Need help right now?
Talk to RoboMo™ and get instant answers.


Derbyshire presents a broad solar landscape, where different towns and housing types create varied installation conditions. Across the region, variation in housing density and roof characteristics play a key role in overall solar performance.
From dense residential zones to more open properties, system design across Derbyshire is shaped by regional diversity.
Savings in Derbyshire depend on how well system size matches energy usage. Homes with higher daytime consumption typically see stronger returns, while others benefit from battery storage.
Based on real comparison data, households typically see savings ranging from £674 to £1434, with most systems delivering around £928 annually.
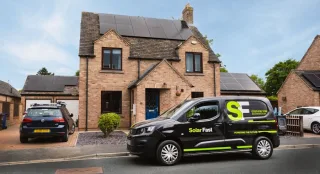
Housing across Derbyshire varies significantly between towns, suburban developments, and rural properties. This creates variation in system sizing and installation approaches.
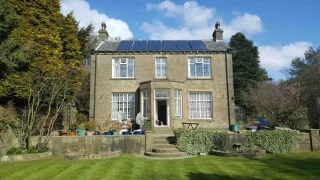
Larger detached homes in rural areas often support bigger systems, while more compact town properties require careful panel placement.
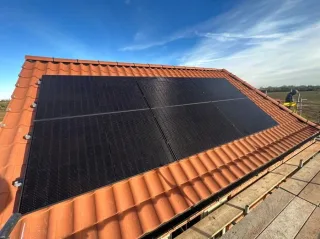
Energy generation in Derbyshire depends on roof orientation, shading, and system size. South-facing roofs generally achieve the highest output, while east-west systems provide more balanced generation.
Typical systems generate around 4218 per year, with higher-performing setups reaching 6517. Most installations include approximately 16 panels.
Local comparisons
3
Real comparison activity from this area
Typical generation
4218 kWh
Average projected yearly output
Best recorded result
6517 kWh
Top projected generation in your local dataset
Typical system size
16 panels
Average setup size being compared nearby
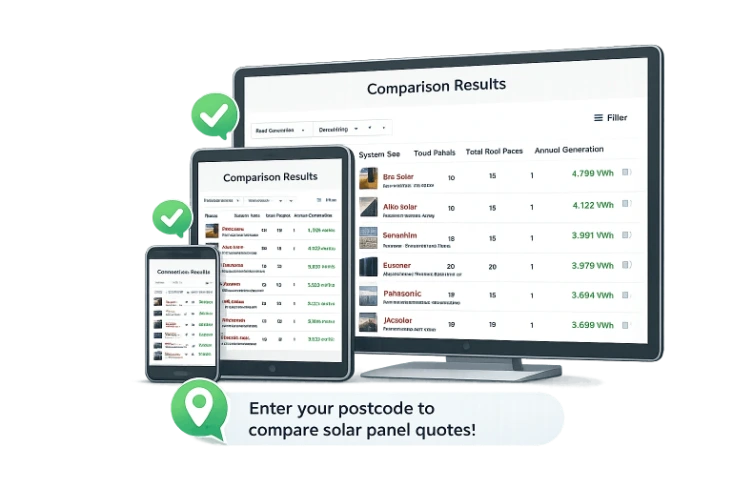
The fastest way to find out what your roof could do
Start your solar comparison and get a roof-specific estimate based on your roof shape, property type, and best installation fit.
Get a local solar estimate in seconds
Speak to a real solar expert
Compare solar and if you install through our partner you get a Free Mo CEO cuddly toy. Tems and conditions apply
Derbyshire solar opportunity score
Based on real comparison activity, system performance, and local demand signals.
Why Derbyshire scores this level
Based on current data, properties in Derbyshire are typically generating around 4218 kWh per year from solar installations.
Local comparison activity shows an average system size of 16 panels, with strong potential savings across the area.
The opportunity score reflects a combination of:
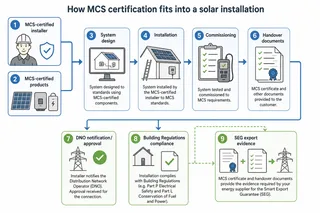
Planning requirements in Derbyshire are typically straightforward for standard installations, although restrictions may apply in protected areas.
Properties in conservation zones or listed buildings may need approval before installation.
Installations across Derbyshire reflect a mix of urban and rural energy usage patterns, influencing system sizing and design.
Properties with more available space typically achieve higher output and flexibility in system configuration.
What we're seeing locally: Properties in Derbyshire can experience different levels of solar exposure depending on surrounding structures, which influences overall system efficiency.
This map highlights where solar comparisons are happening locally. Brighter areas indicate higher demand for solar panel installation.
Typical system sizes in Derbyshire
Estimated savings distribution
Annual generation distribution
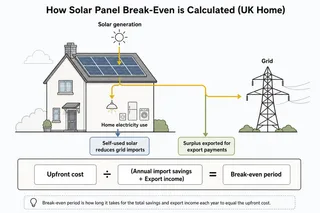
Estimated return over time
Solar interest trend in Derbyshire
Average system size
16 panels
Based on current local comparison activity.
Most common panel class
400W
Derived from the strongest panel entries in the local dataset.
Best recorded generation
6517 kWh
Highest projected annual generation currently in the local page data.
Roof orientation
0% south
East/West: 33%
Mixed: 67%
Flat: 0%
What people in Derbyshire want
This data comes from real residential solar comparisons in Derbyshire, showing how different system sizes and panel types perform across local homes.
If you are planning Home solar panel installation in Derbyshire, these insights help you understand what system sizes are being compared and what generation levels are achievable.
Based on real comparison activity from properties in this area.
| Panel type | Typical setup | Avg annual generation |
|---|---|---|
| 24 panel system High-efficiency panel | 24 panels | 6517 kWh |
| 12 panel system High-efficiency panel | 12 panels | 3073 kWh |
| 11 panel system High-efficiency panel | 11 panels | 3063 kWh |
See what your Residential roof could generate in Derbyshire
Choose property type
Tailor the estimate to the property.
See likely generation and savings
Then request quotes or book an appointment.
Estimated fit: 16 panels
Likely annual generation: 4218 kWh
Possible yearly savings: £928 / year
Find out what is best for your setup fast!
Speak to a real solar expert
Unit 17, Allerton Bywater Network Centre, Letchmire Rd, Allerton Bywater, Castleford WF10 2DB, United Kingdom

10, Goldspot Business Centre, Forge Ln, Armley, Leeds LS12 2PY, United Kingdom SE1 9SG

Unit 1a, Kingsley Court, Kingsley Rd, Lincoln LN6 3TA, United Kingdom LN1 2XG

Most homes in Derbyshire generate around 4218 kWh per year, with typical savings of £928. Compare nearby locations to see how performance and system sizes vary across the area.
Nearby Home solar panel installation Locations
FAQ
Live Chat: