


How much does a solar panel generate?
Published: 2026-07-18 15:39:33
Updated: 2026-07-18 23:38:47
Understand how much does a solar panel generate in the UK, with clear explanations, examples, and practical next steps.
Author and editorial note
Written by the Kilowatts UK renewable-energy editorial team, which specialises in practical UK solar, battery storage, EV charging, and low-carbon home-energy guidance. This guide has been edited for UK homeowners and buyers comparing solar quotes, with figures based on typical UK yield ranges, real-world system design factors, and industry-standard generation assumptions used in domestic solar assessments.
Solar output varies by property, so the figures below should be treated as informed estimates rather than guarantees. A proper design should always account for roof orientation, pitch, shading, usable roof area, inverter specification, local irradiance, and household electricity use.
How much electricity does one solar panel generate?
A typical modern solar panel in the UK is rated at about 350W to 450W. A 400W panel will usually generate around 300 to 450 kWh of electricity per year, which averages roughly 0.8 to 1.2 kWh per day across the year. The exact figure depends mainly on location, roof direction, pitch, shading, panel rating, inverter design, and seasonal weather.
Output is not even through the year. The same panel may produce around 1.5 to 2.5 kWh per day in summer, but only around 0.1 to 0.5 kWh per day in winter. This is why annual generation is the most useful figure when comparing home solar panel options, while daily output is only a rough guide.
For a quick sense check, one 400W panel in a good UK position often generates enough electricity over a year to cover several hundred kilowatt-hours of household use, but it does not produce 400W continuously all day. Solar output rises and falls with daylight, cloud cover, shading, and the angle of the sun.
UK example calculations
These examples show how the same panel or system size can perform differently across the UK. They are not site-specific guarantees, but they are useful for checking whether a quote looks realistic.
South coast home, unshaded south-facing roof
A 400W panel may generate roughly 380 to 440 kWh per year. A 4 kWp system may generate around 3,800 to 4,400 kWh per year.Northern England home, mixed roof orientations
A 400W panel may generate roughly 320 to 380 kWh per year. A 4 kWp system may generate around 3,200 to 3,800 kWh per year.Midlands home, good south-east or south-west roof
A 400W panel may generate roughly 340 to 400 kWh per year. A 4 kWp system may generate around 3,400 to 4,000 kWh per year.Scotland home, unshaded but lower annual irradiance
A 400W panel may generate roughly 280 to 360 kWh per year. A 4 kWp system may generate around 2,800 to 3,600 kWh per year.
As a practical example, a semi-detached home in Bristol or Southampton with ten 400W panels on a mostly south-facing, unshaded roof might reasonably expect annual generation somewhere around 3,800 to 4,300 kWh. A similar 4 kWp system in Leeds, Newcastle, Glasgow, or Inverness could still work well, but the annual estimate may be lower because of local solar resource, roof angle, and weather patterns. The important point is that a quote should not simply multiply the panel wattage by daylight hours. A credible UK solar estimate should show annual kWh output based on the actual roof and local conditions.
What watts and kilowatt-hours actually mean
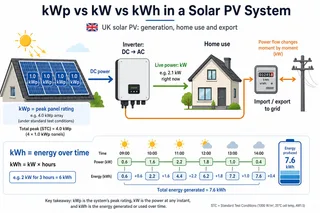
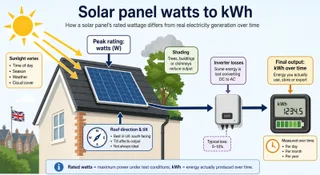
Watts measure power at a moment in time. Kilowatt-hours measure energy produced or used over time. This difference matters because a solar panel’s wattage is not the same as its daily or annual generation.
A 400W panel has a peak output rating of 0.4 kW under laboratory test conditions. Real UK roofs rarely match those exact conditions for long. The sun moves, clouds pass over, panels warm up, inverters have conversion losses, and shading can interrupt production.
Kilowatt-hours are what appear on electricity bills and solar generation estimates. If a panel generates 1 kWh in a day, it has produced one unit of usable electrical energy before or after system losses depending on where it is measured. Annual generation estimates should normally be shown in kWh per year, not just as a panel wattage or system size.
Typical UK solar system output by size
Most homes install more than one panel, so total generation is usually discussed at system level. A system’s size is the combined peak rating of all panels. Ten 400W panels make a 4 kWp solar array.
Typical UK annual generation ranges are broad because two systems with the same panel count can perform differently on different roofs.
- A 3 kWp system usually generates about 2,400 to 3,300 kWh per year.
- A 4 kWp system usually generates about 3,200 to 4,400 kWh per year.
- A 5 kWp system usually generates about 4,000 to 5,500 kWh per year.
- A 6 kWp system usually generates about 4,800 to 6,600 kWh per year.
Many UK homes install systems between 3 kWp and 5 kWp. A 4 kWp system often uses around 9 to 11 panels, depending on the wattage of each panel. A 5 kWp system often uses around 11 to 14 panels. A larger system does not automatically mean a better financial outcome. The best size depends on roof space, electricity usage, export assumptions, battery suitability, DNO requirements, and whether the household can use enough solar electricity during the day.
Why UK location changes solar generation
Solar generation is generally higher in southern England than in northern Scotland, but local roof conditions can matter more than the region. A shaded south coast roof can perform worse than an unshaded roof further north.
South coast and south-west England can often reach around 950 to 1,100 kWh per kWp per year. The Midlands and much of Wales often sit around 850 to 1,000 kWh per kWp per year. Northern England often sits around 800 to 950 kWh per kWp per year, while Scotland often sits around 700 to 900 kWh per kWp per year.
These ranges are useful for early expectations, but a proper estimate should consider the actual property. Nearby buildings, trees, chimneys, roof shape, and panel layout can all change the result. For example, a west-facing roof in Manchester with no shading may outperform a nominally better south-facing roof in Kent if the Kent roof is heavily shaded by trees or neighbouring buildings. The regional solar map matters, but roof-specific design matters more.
Roof direction, pitch, and shading matter more than many people expect
A good solar design is based on usable roof area, not just the total roof size. Installers have to work around chimneys, roof windows, vents, hips, valleys, edge zones, access requirements, and mounting limitations.
Shading
Trees, chimneys, dormers, nearby buildings, and roof features can reduce generation. Even partial shade can affect a string of panels if the system is not designed correctly.Roof pitch
A pitch of around 30 to 40 degrees is often close to ideal in the UK, but shallower and steeper roofs can still work. Flat roof systems usually need frames and spacing to reduce row-to-row shading.Panel layout
Different roof orientations may need separate inverter inputs or panel-level electronics. Mixing shaded and unshaded panels on the same string can reduce output if handled poorly.Roof condition
Old, fragile, or damaged roofs may need repairs before panels are fitted. This can affect timing, cost, and whether installation is sensible.Roof direction
South-facing roofs usually generate the most annual electricity, while south-east and south-west roofs can still perform well. East-facing panels produce more in the morning, and west-facing panels produce more later in the day.
Optimisers or microinverters can reduce the impact of panel-level shading, but they cannot recover sunlight that never reaches the panel. Tree growth is also worth considering because a roof that is clear today may become shaded in future years.
Solar generation changes sharply by season
UK solar panels generate most of their electricity between March and September. June and July are usually the strongest months, while December and January are usually the weakest.
A system may generate 4 to 6 times more electricity in June than in December. This is important for homes with electric heating or heat pumps, because winter electricity demand can be high when solar generation is at its lowest.
Solar panels still work on cloudy days, but output is reduced. They do not need hot weather to generate electricity. In fact, cool bright conditions can be good for panel efficiency because very hot panels tend to produce less efficiently than cooler panels. Snow cover can stop generation until panels clear. In most UK domestic projects this is not a major annual issue, but it can explain short periods of very low winter output.
What can one solar panel run?
One 400W solar panel cannot reliably run a household appliance continuously because its output changes throughout the day. It may produce enough energy over a sunny day to cover some appliance use, but only if the timing lines up or the energy is stored in a battery.
A 400W panel producing 1 kWh in a day could cover roughly 1 kWh of appliance use that day. A fridge-freezer may use around 0.5 to 1.5 kWh per day depending on model and age. A washing machine cycle may use around 0.5 to 1.5 kWh. A tumble dryer cycle may use around 2 to 5 kWh, and an electric oven may use around 1 to 2 kWh per hour of active cooking.
Heat pumps and EV chargers need much more energy than a single panel can reliably provide. Solar can still support them, especially if charging or heating patterns can use daytime generation, but system size and seasonal mismatch must be considered realistically. A useful way to think about this is energy over a day, not instant power. One panel may contribute towards a washing cycle, refrigeration, laptop charging, or daytime background load, but a whole-home solar system is needed to make a meaningful dent in annual electricity use.
Generation is not the same as bill saving
A 4 kWp solar system may generate a similar amount of electricity to the annual use of a medium-use UK household, but that does not mean the home is self-sufficient. Solar generation happens during daylight, while household demand is often highest in the morning and evening.
Without a battery, many homes use around 30% to 50% of their solar generation on site. With a battery, many homes can use around 60% to 80% on site. Actual self-use depends on occupancy, appliance timing, battery size, EV charging, heating type, and tariff structure.
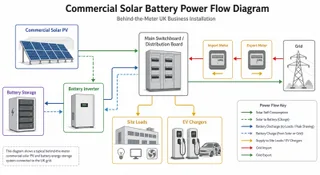
A battery does not increase how much electricity the panels generate. It stores more of the electricity for later use. That can improve self-consumption, but it adds cost and should be sized around real usage rather than chosen only because the solar array is large. If storage is part of the plan, compare the solar estimate with suitable residential solar battery storage options. Exported electricity may be paid under the Smart Export Guarantee if the installation is eligible. Export rates vary by supplier and are usually lower than import electricity prices, so using solar electricity on site often saves more per kWh than exporting it. This is why two homes with the same solar generation can see different savings. A household with daytime occupancy, smart appliance scheduling, an EV charged during daylight, or a well-sized battery may use more of its solar electricity than a home that is empty all day and exports most generation.
System losses and design choices affect usable output
Solar panels produce DC electricity, while UK homes use AC electricity. An inverter converts DC to AC, and that conversion causes some energy loss. Cable losses, dirt, heat, shading, mismatch, and equipment performance also reduce usable output.
Typical real-world system losses are often around 10% to 20%. Good design reduces avoidable losses, but no system turns every watt of panel rating into usable household electricity all year round.
Inverter sizing is one area where design judgement matters. Oversizing the solar array compared with the inverter is common, and some inverter clipping on peak summer days can be acceptable if the annual yield improves. A larger array does not always need a larger inverter, especially where peak conditions are rare. Inverter location also matters. A very hot loft can reduce inverter lifespan, while awkward locations can make maintenance harder. Safe cable routing, labelling, shutdown arrangements, and access are practical details that affect the quality of an installation even though they are not always obvious in a headline generation estimate.
How to check a solar quote’s generation estimate
A good quote should show more than the number of panels. The key figure to look for is estimated annual generation in kWh, supported by the assumptions used to calculate it.
- Total system size in kWp.
- Number of panels.
- Wattage per panel.
- Estimated annual generation in kWh.
- Assumed roof direction.
- Assumed roof pitch.
- Shading estimate.
- Inverter size.
- Battery size if included.
- Estimated self-consumption.
- Estimated export.
- DNO application status if relevant.
- Warranty lengths for panels, inverter, battery, and workmanship.
- MCS certification status where relevant.
Generation estimates should be based on recognised calculation methods or proper modelling, not a rough claim that every panel will produce its rated output. If two quotes have the same system size but very different annual generation figures, ask what assumptions have changed. If you are comparing proposals for a workplace rather than a home, use a dedicated commercial solar comparison route so the estimates reflect business usage and roof constraints. Be cautious if a quote only shows a headline payback claim without explaining the annual generation, self-consumption assumption, export rate, import tariff, and battery behaviour. The most useful proposal is one that lets you see how the numbers have been built.
When solar panels may generate less than expected
The most common causes of disappointing generation are not usually the panels themselves. They are often shading, poor layout, unsuitable string design, unrealistic assumptions, or roof constraints that were not properly considered.
Generation may be lower where a roof is heavily shaded, faces a weak direction, has little usable area, or needs panels split across several awkward sections. Grid voltage issues can also cause inverter shutdowns in some locations, and export limits can restrict output in certain circumstances.
Panels also degrade slowly over time. Many panels have performance warranties of 25 to 30 years, and output usually falls gradually rather than suddenly. Typical degradation is often around 0.25% to 0.5% per year. Inverters usually have shorter lifespans than panels and may need replacement earlier. Solar panels may be less suitable if the roof needs near-term replacement, planning restrictions prevent installation, the property has very low electricity use, export capacity is severely restricted, or the upfront cost does not fit the household’s plans.
The practical answer for UK homes
For most UK homeowners, a sensible expectation is that one 400W solar panel will generate around 300 to 450 kWh per year. Ten 400W panels, making a 4 kWp system, may generate around 3,000 to 4,500 kWh per year depending on roof and location.
The best next step is not to focus only on panel wattage. Check the usable roof area, shading, annual kWh estimate, self-consumption, battery suitability, and whether the design fits how the property actually uses electricity. You can also book a free home energy survey to review the roof, usage pattern, and likely system output.
A good solar proposal should make the generation assumptions clear. If it only states the number of panels and a headline system size, ask for the estimated annual output in kWh and the roof conditions used to calculate it.
Ready to compare your options?
Get tailored comparisons and connect with trusted installers in under a minute.
Plan, Compare & Buy Renewable Energy Solutions
AI does the thinking.
You get the perfect solar match.
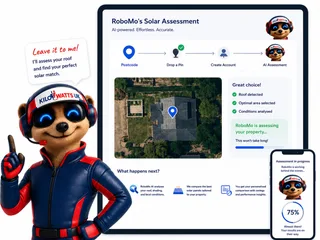
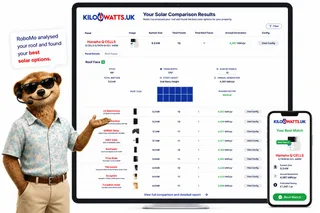
Use RoboMo™ to assess your property, compare available technologies and connect with trusted UK installers, suppliers and manufacturers.
Simply enter your postcode, drop a pin on your roof, create your free account and let RoboMo™ analyse your property to find the best solar panels for your home.

You don't have to think
RoboMo™'s AI analyses your roof and does all the hard work.

Accurate & tailored
AI-powered assessment based on your roof, location, and conditions.

Best options, maximum savings
Compare top solar panels for the best performance and value.

Simple, fast & effortless
Provide a few details, sit back and watch your results unfold.
STEP 1
Choose Home, Business or Industrial
Enter your postcode to start your assessment.
STEP 2

Drop a pin on your roof
STEP 3

Create your free account
STEP 4

Sit back and watch RoboMo™ work
RoboMo™ analyses your roof and builds your personalised solar comparison.

Step 1
Enter your postcode
Start designing your wind energy system in seconds.
Are you an installer, distributor or renewable energy business?
Kilowatts UK is expanding the Flower Turbines partner network across the UK.
Become A Flower Turbines PartnerKilowatts UK is an authorised representative
Flower Turbines
Compact vertical-axis turbines built for real UK sites, not just open farmland.
They start in light wind, sit in a small footprint, and are bird-safe by design. Cluster them as a bouquet and the group performs better together than the same turbines standing alone. Enter your postcode for a location-based generation estimate. Figures use area weather data and will differ if buildings, trees or hills sit in the way.
Starts in light UK wind
Built to generate in typical UK wind, not only open farmland.
Small rooftop or ground footprint
Compact towers for roofs, yards and tight sites.
Bird-safe slow rotation
Slow vertical-axis spin, bird-safe by design.
Bouquet clusters raise output
Grouped turbines outperform the same units standing alone.

STEP 2

Choose a location
STEP 3

Place your cluster
Tap the map where you want the turbine cluster to go.
STEP 4

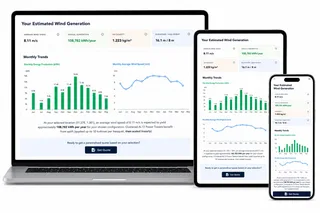
Instant generation forecasts
Compare different turbine layouts and see annual generation forecasts instantly.
STEP 5

No commitment required
Explore different configurations before deciding whether to request a quotation.
Related articles
Mo's Mission Nominations
FAQ
Need Help? RoboMo's Got Answers
How much electricity does one solar panel generate in the UK?
A typical modern 400W solar panel in the UK generates around 300 to 450 kWh of electricity per year. This averages about 0.8 to 1.2 kWh per day across the year, but daily output varies heavily by season, weather, roof direction, pitch, shading, and location.
Does a 400W solar panel produce 400W all day?
No. A 400W panel has a peak rating measured under standard test conditions, not a constant output. In real UK conditions, output rises and falls throughout the day depending on sunlight, cloud cover, temperature, shading, and the angle of the sun. The annual kWh figure is more useful than the panel wattage when estimating real generation.
How do I estimate annual solar panel output?
A simple UK estimate is to multiply the panel or system size in kWp by the expected annual yield. UK solar generation is often around 750 to 1,100 kWh per kWp per year, depending on location and roof conditions. For example, one 400W panel is 0.4 kWp, so at 850 kWh per kWp it would generate about 340 kWh per year.
How much electricity does a 4 kWp solar system generate?
A typical 4 kWp solar system in the UK generates around 3,200 to 4,400 kWh per year. A very well-positioned, unshaded system in southern England may be towards the higher end, while a shaded, poorly orientated, or more northerly system may generate less.
How many panels make up a typical UK home solar system?
Many UK homes install systems between 3 kWp and 5 kWp. A 4 kWp system using 400W panels would need 10 panels. A 5 kWp system would need around 12 or 13 panels, depending on the exact panel wattage and usable roof space.
Why does solar panel generation vary across the UK?
Solar generation is generally higher in southern England than in northern Scotland because of differences in annual sunlight levels. However, the roof itself often matters more than the region. An unshaded roof in northern England can outperform a shaded roof in the south. Roof orientation, pitch, shading, layout, and local obstructions all affect the final output.
Which roof direction is best for solar panels?
South-facing roofs usually generate the most annual electricity in the UK. South-east and south-west roofs can also perform well. East-facing panels generate more in the morning, while west-facing panels generate more later in the day, which can suit households that use more electricity in the afternoon and evening.
Do solar panels work in winter and on cloudy days?
Yes, solar panels still work in winter and on cloudy days, but they generate less electricity. UK solar systems usually produce most of their electricity between March and September. December and January are normally the weakest months because days are shorter and the sun is lower in the sky.
What can one solar panel run?
One 400W solar panel may generate enough energy over a day to contribute to smaller household loads such as refrigeration, laptop charging, lighting, or part of a washing cycle. It cannot reliably run a large appliance continuously because its output changes throughout the day. Larger loads such as EV chargers, tumble dryers, ovens, and heat pumps usually need a full solar system and, in some cases, a battery to make better use of the generation.
Is solar generation the same as bill saving?
No. Generation is the amount of electricity the system produces, while bill saving depends on how much of that electricity the household uses instead of importing from the grid. Without a battery, many homes use around 30% to 50% of their solar generation on site. With a suitable battery, self-use may increase to around 60% to 80%, depending on household usage patterns.
Does a solar battery increase solar panel generation?
No. A battery does not make the panels generate more electricity. It stores spare solar electricity so it can be used later, usually in the evening or overnight. This can improve self-consumption and reduce grid imports, but the battery should be sized around real electricity use rather than chosen only because the solar array is large.
What system losses should I expect from solar panels?
Real-world solar systems usually have losses of around 10% to 20%. Losses can come from inverter conversion, cable runs, heat, dirt, shading, mismatch between panels, and equipment performance. Good design helps reduce avoidable losses, but no system converts every watt of panel rating into usable electricity all year.
Why might my solar panels generate less than expected?
Solar panels may generate less than expected because of shading, poor roof orientation, unsuitable panel layout, unrealistic quote assumptions, inverter issues, grid voltage problems, export limits, dirt, or equipment faults. Gradual panel degradation is also normal over time, although most modern panels are designed to keep producing for 25 to 30 years.
What should I check in a solar quote’s generation estimate?
A good solar quote should show the system size in kWp, number of panels, panel wattage, estimated annual generation in kWh, roof direction, roof pitch, shading assumptions, inverter size, battery details if included, estimated self-consumption, estimated export, warranty information, and MCS certification status where relevant. Be cautious if a quote only gives a headline payback figure without explaining the assumptions behind it.
How much solar electricity is enough for a UK home?
A 4 kWp system may generate a similar amount of electricity to the annual usage of a medium-use UK household, but that does not mean the home will be self-sufficient. Solar production happens during daylight, while household demand is often highest in the morning and evening. The right system size depends on roof space, electricity use, battery suitability, export assumptions, and whether the household can shift usage into solar-generating hours.