
Need help right now?
Talk to RoboMo™ and get instant answers.


14 local comparisons · Greater London
Greater London presents a broad solar landscape, where different towns and housing types create varied installation conditions. Across the region, differences in property types and solar exposure across towns play a key role in overall solar performance.
From dense residential zones to more open properties, system design across Greater London is shaped by regional diversity.
Savings in Greater London depend on how well system size matches energy usage. Homes with higher daytime consumption typically see stronger returns, while others benefit from battery storage.
Based on real comparison data, households typically see savings ranging from £288 to £3142, with most systems delivering around £914 annually.
Housing across Greater London varies significantly between towns, suburban developments, and rural properties. This creates variation in system sizing and installation approaches.
Larger detached homes in rural areas often support bigger systems, while more compact town properties require careful panel placement.
Energy generation in Greater London depends on roof orientation, shading, and system size. South-facing roofs generally achieve the highest output, while east-west systems provide more balanced generation.
Typical systems generate around 4156 per year, with higher-performing setups reaching 14283. Most installations include approximately 14 panels.
Typical yearly generation
4156 kWh
What a usual system here is modelled to produce
Typical yearly saving
£914
From £288 to £3142
Usual system
14 panels
Mostly 400W
Best result in the data
14283 kWh
Highest modelled yearly output
Enter a postcode. RoboMo™ uses it to see how many panels of each type fit that roof.
Enter your postcode to start your assessment.
RoboMo™ analyses your roof and builds your personalised solar comparison.
Properties here are typically modelled at 4156 kWh a year, from systems of about 14 panels. The score mixes that output with how many people are comparing solar in the area.
Planning requirements in Greater London are typically straightforward for standard installations, although restrictions may apply in protected areas.
Properties in conservation zones or listed buildings may need approval before installation.
Observed installation patterns across Greater London show variation between towns, with system sizes and configurations differing based on property type and density.
Battery storage is increasingly used across the region to improve self-consumption and balance generation.
What we're seeing locally: Properties in Greater London can experience different levels of solar exposure depending on surrounding structures, which influences overall system efficiency.
Local score
out of 100
Yearly output
kWh, best 14283
Yearly saving
up to £3142
South-facing roofs
of modelled systems
Average system
panels, scale to 40
Common panel class
scale to 600W
Best modelled year
kWh peak in the data
Roof direction
South 59%
East/west 25%
Mixed 16%
Flat 0%
Figures come from real residential comparisons for local homes. They show the system sizes people compare and the generation those sizes reach.
| Panel type | Typical setup | Average yearly generation |
|---|---|---|
| 48 panel system High-efficiency panel | 48 panels | 14284 kWh |
| 28 panel system High-efficiency panel | 28 panels | 12315 kWh |
| 30 panel system High-efficiency panel | 30 panels | 5607 kWh |
| 10 panel system High-efficiency panel | 10 panels | 3834 kWh |
| 7 panel system High-efficiency panel | 7 panels | 3246 kWh |
79 College Rd, Harrow HA1 1BD, United Kingdom HA1 1BD

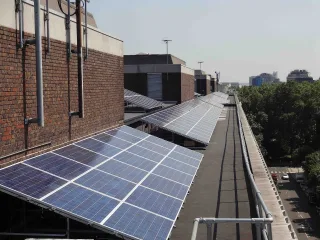
264 Merton Rd, London SW18 5JL, UK SW18 5JL
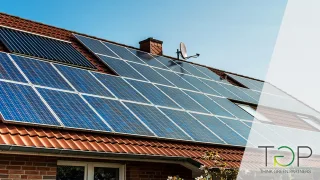
56-58, Solutions House, Peregrine Rd, Ilford IG6 3SZ, UK IG6 3SZ
Most homes here are modelled around 4156 kWh a year, with typical savings of £914.
Compare installers and prices for solar in Greater London.
Get solar quotes in Greater LondonFAQ
Live Chat: