Need help right now?
Talk to RoboMo™ and get instant answers.


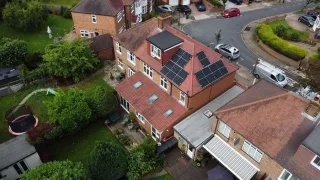
London, Greater London supports a range of installation approaches depending on property layout, where system design is shaped by housing estates with consistent roof designs. Local installation data highlights how system positioning and performance optimisation factors directly impact system output.
Across London, Greater London, system design is influenced by roof layout, nearby structures, and shading patterns. This creates variation in system sizing and output, making site-specific planning essential for achieving consistent generation.
Savings in London, Greater London depend on how well system size matches energy usage. Homes with higher daytime consumption typically see stronger returns, while others benefit from battery storage.
Based on real comparison data, households typically see savings ranging from £1234 to £3142, with most systems delivering around £2188 annually.
Across London, Greater London, different housing layouts create variation in how solar systems are designed. Detached properties often allow for larger systems, while more compact homes require careful planning.
Roof angle, usable space, and nearby obstructions all influence final system design.
Energy generation in London, Greater London depends on roof orientation, shading, and system size. South-facing roofs generally achieve the highest output, while east-west systems provide more balanced generation.
Typical systems generate around 9946 per year, with higher-performing setups reaching 14283. Most installations include approximately 39 panels.
Local comparisons
2
Real comparison activity from this area
Typical generation
9946 kWh
Average projected yearly output
Best recorded result
14283 kWh
Top projected generation in your local dataset
Typical system size
39 panels
Average setup size being compared nearby
The fastest way to find out what your roof could do
Start your solar comparison and get a roof-specific estimate based on your roof shape, property type, and best installation fit.
Get a local solar estimate in seconds
Speak to a real solar expert
Compare solar and if you install through our partner you get a Free Mo CEO cuddly toy. Tems and conditions apply

London solar opportunity score
Based on real comparison activity, system performance, and local demand signals.
Why London scores this level
Based on current data, properties in London are typically generating around 9946 kWh per year from solar installations.
Local comparison activity shows an average system size of 39 panels, with strong potential savings across the area.
The opportunity score reflects a combination of:
Most installations in London, Greater London fall under permitted development, but conservation areas and listed buildings may require additional approvals.
Positioning and visual impact can influence planning decisions in certain cases.
Observed installation patterns in London, Greater London show a preference for systems that balance available roof space with household demand. Battery storage is increasingly used to improve self-consumption.
Careful panel placement around obstructions can significantly improve long-term system performance.
What we're seeing locally: London, Greater London includes a mix of housing layouts that can influence solar performance, particularly where surrounding buildings or trees introduce partial shading.
This map highlights where solar comparisons are happening locally. Brighter areas indicate higher demand for solar panel installation.
Typical system sizes in London
Estimated savings distribution
Annual generation distribution
Estimated return over time
Solar interest trend in London
Average system size
39 panels
Based on current local comparison activity.
Most common panel class
400W
Derived from the strongest panel entries in the local dataset.
Best recorded generation
14283 kWh
Highest projected annual generation currently in the local page data.
Roof orientation
100% south
East/West: 0%
Mixed: 0%
Flat: 0%
What people in London want
This data comes from real residential solar comparisons in London, showing how different system sizes and panel types perform across local homes.
If you are planning Home solar panel installation in London, these insights help you understand what system sizes are being compared and what generation levels are achievable.
Based on real comparison activity from properties in this area.
| Panel type | Typical setup | Avg annual generation |
|---|---|---|
| 48 panel system High-efficiency panel | 48 panels | 14284 kWh |
| 30 panel system High-efficiency panel | 30 panels | 5607 kWh |
See what your Residential roof could generate in London
Choose property type
Tailor the estimate to the property.
See likely generation and savings
Then request quotes or book an appointment.
Estimated fit: 39 panels
Likely annual generation: 9946 kWh
Possible yearly savings: £2188 / year
Find out what is best for your setup fast!
Speak to a real solar expert
79 College Rd, Harrow HA1 1BD, United Kingdom HA1 1BD

28 Ashmount Rd, London N19 3BJ, United Kingdom


1 Chalfont Park, Chalfont St Peter, Gerrards Cross SL9 0BG, United Kingdom SL9 0BG

Most homes in London generate around 9946 kWh per year, with typical savings of £2188. Compare nearby locations to see how performance and system sizes vary across the area.
Nearby Home solar panel installation Locations
FAQ
Live Chat: