


Commercial solar payback calculator in the UK
Published: 2026-07-18 19:13:16
Updated: 2026-07-26 18:21:49
Find out commercial solar payback calculator in the UK, including costs, what affects price, and how to choose an installer.
Commercial solar payback calculator in the UK
A commercial solar payback calculator estimates how long a UK business solar PV system may take to recover its net cost through electricity bill savings, export income, and tax or finance effects. For most buyers, the key question is simple: “How many years until the panels have paid for themselves?”
The answer depends on the site. The biggest drivers are the installed cost, how much electricity the business uses during daylight hours, the import electricity rate, the export rate, roof suitability, grid connection limits, finance costs, and maintenance. Many UK commercial solar projects are often discussed in the 4 to 8 year simple payback range, but the real result can be shorter or much longer once the building has been surveyed.
A useful calculator should not just ask for roof size and produce a headline saving. For a commercial property, it should model when the business uses electricity, how much solar power is used on site, what surplus is exported, and whether extra project costs have been included. These can include structural work, roof repairs, access equipment, Distribution Network Operator applications, export limitation equipment, switchgear upgrades, monitoring, and inverter replacement. In short, commercial solar payback is usually strongest where a business has high daytime electricity demand, a suitable roof, a good import electricity rate, limited shading, and no major grid or roof complications.
- High daytime electricity use usually improves payback.
- Electricity used on site is usually worth more than exported electricity.
- Roof condition and grid capacity can change the business case.
- A calculator is an estimate, not a final quote.
- UK government support is more limited than during the former Feed-in Tariff era.
- The best estimates use real electricity data, not only annual consumption.
How commercial solar payback is calculated
The simplest commercial solar payback calculation is:
Net installed cost ÷ annual net benefit = simple payback period
Net installed cost means the total project cost after any confirmed grant, incentive, or relevant deduction included in the model. Annual net benefit usually includes avoided grid electricity costs, export income, and any relevant tax effects, minus maintenance, monitoring, insurance, finance, and replacement assumptions. For example, if a commercial solar system costs £80,000 after confirmed adjustments and produces a net annual benefit of £12,000, the simple payback is: £80,000 ÷ £12,000 = 6.7 years That is a simple example, not a quote. The result can change quickly if the business exports more electricity than expected, if the import tariff changes, or if roof and grid costs are higher than first assumed. A good commercial solar payback calculator should separate the calculation into clear parts. Net installed cost: The full installed cost after any confirmed support, including surveys, access, electrical work, grid costs, roof-related enabling works, and professional fees where applicable. On-site bill saving: The value of solar electricity used directly by the business instead of buying electricity from the grid. Export income: The value of surplus solar electricity sent to the grid under an export tariff, Smart Export Guarantee arrangement, or power purchase agreement where applicable. Operating costs: The expected cost of inspections, maintenance, monitoring, cleaning where needed, insurance requirements, and fault response. Long-term costs: The allowance for inverter replacement, equipment degradation, communications repairs, and monitoring equipment replacement. Finance and tax treatment: The effect of borrowing costs, lease structures, hire purchase, power purchase agreements, capital allowances, VAT recovery, and corporation tax position where relevant. Simple payback is useful because it is easy to understand. It does not show the whole investment case. For larger businesses, net present value, internal rate of return, cash flow, finance terms, and tax treatment can be just as important. A calculator should also show the assumptions behind the result. If it only gives one payback figure without showing generation, self-consumption, export, maintenance, and finance assumptions, it is difficult to judge whether the estimate is realistic.
Inputs you need before using a calculator
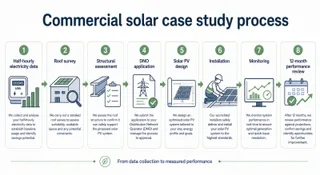
The quality of a commercial solar payback estimate depends on the quality of the data. Annual electricity consumption is a useful starting point, but it is often not enough. Half-hourly electricity data is much better because it shows how much power the business uses when solar panels are actually generating.
For many UK businesses, the strongest starting evidence is:
- 12 months of electricity bills.
- 12 months of half-hourly consumption data.
- Current electricity rates and contract details.
- A clear view of operating hours and planned changes.
- Site postcode and address.
- Annual electricity consumption in kWh.
This helps the calculator estimate self-consumption, export, seasonal variation, and whether solar production is likely to match the working day. Useful inputs include the following. A calculator that asks only for annual kWh and roof area may be useful for a first screen, but it can easily overstate savings. It may ignore export limits, rooflights, access routes, fire breaks, structural capacity, cable routes, or the fact that the site’s electricity demand is mostly outside daylight hours. For example, two businesses may both use 500,000 kWh per year, but have very different payback results. A food processor running chillers and production lines during the day may use most of its solar generation on site. A venue with low daytime demand and high evening use may export more electricity and receive a lower value for that exported power. Half-hourly electricity usage data. Import electricity rate and contract end date. Standing charge and relevant non-commodity charges. Export tariff assumption or export offer. Roof type, area, pitch, orientation, and shading. Roof age, condition, and structural information. Main electrical intake details. Available import and export capacity. Operating hours and weekend use. Planned EV charging, heat pumps, refrigeration, or process electrification. Installed cost assumption in pounds per kWp. Maintenance, insurance, inverter, and finance assumptions. Lease length, landlord consent position, and roof warranty details where relevant.
Typical UK commercial solar costs and payback ranges
Commercial solar PV costs vary by system size, roof type, access, grid connection, electrical complexity, and specification. As a broad UK guide, smaller commercial systems may cost roughly £900 to £1,500 per kWp, medium systems may cost roughly £700 to £1,200 per kWp, and larger rooftop systems may cost roughly £600 to £1,000 per kWp. Ground-mounted commercial systems can vary more because of civil works, fencing, planning, and grid connection requirements.
These are broad market ranges, not fixed prices. A final cost can only be confirmed after surveys, design work, grid checks, and scope review.
Typical simple payback ranges also vary. Strong daytime-use sites: Often around 4 to 6 years. Average commercial sites: Often around 5 to 8 years. Low self-consumption sites: Can move beyond 8 to 10 years. Constrained sites: Can be longer if roof works, grid upgrades, or planning issues are significant. Roof access and working at height requirements. Structural survey and any strengthening work. A site with excellent electricity usage but a weak roof may have a poor business case once roof repairs are included. A site with a modest roof but very high daytime demand may perform better than expected. A cheap headline installation price can also be misleading if it excludes scaffolding, DNO work, monitoring, structural checks, cable routes, or insurer requirements. The installed price is affected by practical site details. A simple worked example can show why self-consumption matters. These examples are illustrative. A real calculator should use the site’s actual consumption data, proposed system design, and agreed electricity assumptions. Battery storage should normally be modelled separately. Batteries can improve self-consumption or support peak shaving, but they do not automatically improve payback. Their value depends on tariff structure, load profile, cycling strategy, degradation, warranty limits, and control software. Roof covering type and mounting system. Asbestos, fragile roof sheets, or roof replacement needs. Cable route from roof to switchroom. Main switchgear capacity. DNO application and export limitation requirements. Fire safety design and insurer documentation. Monitoring, metering, and communications hardware. Maintenance access and future roof repair allowances.
Why daytime electricity use matters so much
The best financial value usually comes from using solar electricity on site. If a business avoids buying electricity at a higher import rate, that saving is normally worth more than exporting surplus electricity at a lower export rate. This is why two identical solar systems can have very different payback periods.
A refrigerated warehouse, factory, leisure centre, data centre, food processor, office, farm, or school may all have different results. The shape of electricity demand matters as much as the annual total. A business operating five to seven days per week during daylight hours often has a stronger case than a business with low daytime usage and heavy evening demand.
Self-consumption is the percentage of solar generation used directly by the site. High self-consumption usually improves payback. Low self-consumption can still work, but it makes the calculation more dependent on export terms and grid capacity. Common self-consumption issues include the following.
- Weekend shutdowns can increase export.
- Summer holidays can reduce on-site use for schools.
- Warehouses with low electrical demand may export more than expected.
- EV charging can improve on-site solar use if vehicles charge during daylight.
- Heat pumps or electrified processes can change future demand.
- Time-of-use tariffs need more detailed modelling than flat tariffs.
A good calculator should show estimated annual generation, on-site use, export, bill saving, export income, net annual benefit, and payback period separately. If those figures are bundled into one annual saving number, it is harder to see whether the result is realistic. A simple comparison makes the point clear. If a business uses solar electricity on site, each kWh may avoid buying grid electricity at the business’s import rate. If that same kWh is exported, it is valued at the export rate instead. In many cases, the export rate is lower than the import rate, so using more solar on site improves the payback. This is also why “fill the roof” is not always the best design. A smaller system that matches the business’s daytime load may produce a better return than a larger system that exports a high share of its generation. Night-shift businesses may need careful modelling because solar generation is mainly daytime.
UK government support, export income, and tax treatment
Businesses sometimes search for a commercial solar payback calculator because they have seen announcements or discussion about UK solar support. Those announcements can affect market confidence, but they do not replace site-specific financial modelling. For new installations, the UK no longer has the old national Feed-in Tariff scheme, which closed to new applicants in 2019.
The Smart Export Guarantee requires certain licensed electricity suppliers to offer export tariffs to eligible small low-carbon generators, but export rates vary and may not apply in the same way to every commercial project. Larger commercial systems may need a separate export agreement or power purchase arrangement. Export income should not be assumed at the same value as avoided import electricity.
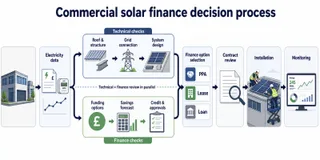
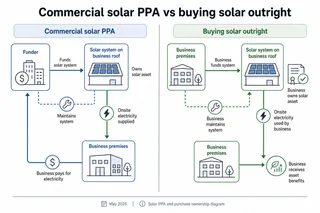
Local grants may exist in some councils, combined authorities, or regional net zero programmes, but they are not universal. A calculator should only include a grant if the business is eligible and the funding is confirmed or realistically available. It is safer to model the project without unconfirmed grant income, then add a separate scenario if funding is likely. Tax treatment can also affect payback. Commercial VAT, capital allowances, corporation tax, leasing, hire purchase, and power purchase agreements all have different implications. VAT-registered businesses may be able to reclaim VAT in some circumstances, but this depends on the business and should be checked with an accountant. A reliable calculator should make clear whether results are: Before tax or after tax. Cash purchase, loan-funded, lease-funded, or PPA-based. Including or excluding VAT. Including or excluding capital allowances. Including or excluding finance interest and fees. Based on current electricity rates or assumed future rates. For buyer decisions, this distinction matters. A cash purchase calculation may show a different payback from a financed project. A power purchase agreement may reduce upfront cost but should be compared carefully against ownership, contract length, electricity price escalation, maintenance responsibility, and exit terms.
Roof, grid, and planning checks that can change the result
A commercial solar calculator can produce a promising result before the project has been surveyed, but final payback can change after technical checks. In real projects, roof condition, grid connection, and electrical integration often decide whether the headline numbers are achievable.
Roof area is not the same as usable solar area. Rooflights, vents, plant rooms, parapets, fall protection zones, maintenance routes, fire access requirements, and shading can all reduce the panel layout. Flat roofs also need row spacing to reduce self-shading, and ballasted systems may be limited by roof load capacity.
Roof condition is especially important. If the roof will need replacement during the life of the solar system, it may be better to repair or replace the roof before installation. Removing and reinstalling panels later can add cost and disruption, which can weaken the payback. Grid connection can also affect system size and payback. Commercial solar systems normally need Distribution Network Operator approval. Depending on size and connection type, the project may fall under G98 or G99 processes. Larger commercial systems commonly require a G99 application. If the network cannot accept the proposed export level without reinforcement, the business may need export limitation equipment, a smaller system, or additional grid costs. Planning and permissions should not be ignored. Many rooftop commercial solar systems may fall under permitted development rights, but listed buildings, conservation areas, scheduled monuments, designated land, ground-mounted systems, and some larger or more visible arrays need closer review. Building regulations, electrical compliance, fire risk assessment updates, and landlord consent can still apply even where planning permission is not needed. Key checks before relying on a payback figure include the following.
- Structural suitability of the roof.
- Remaining roof life and warranty position.
- Shading from nearby buildings, trees, vents, or plant.
- Fire access and insurer requirements.
- Electrical intake and switchgear capacity.
- DNO application route and export capacity.
A calculator should be treated as a first-stage estimate until these checks have been completed. Planning constraints and landlord consent. Cable routes and metering arrangements. Monitoring and maintenance access.
When commercial solar may not be suitable
Commercial solar is not automatically a good investment for every business. The payback can look attractive in a simple calculator but weaken once site constraints, lease terms, export limits, or roof works are included. A cautious estimate is usually more useful than an optimistic one.
Solar may be less suitable where the business plans to move premises soon, the roof is near the end of its life, the site has severe shading, or the building has very low daytime electricity use. It can also be difficult where the landlord will not approve roof alterations, the electrical intake is unsuitable, or the grid connection requires expensive reinforcement.
The main warning signs are practical rather than theoretical. The roof needs replacement during the expected life of the panels. The site uses most electricity at night. The business has a short lease or uncertain occupancy. Landlord consent is unlikely. Export capacity is very limited. Access and structural works are expensive. A smaller, better-matched system can sometimes be more sensible than filling the roof. Oversizing a system can increase export, curtailment, grid complexity, and capital cost without improving payback. It is also worth considering timing. If the roof is due for refurbishment, if the business is renegotiating its electricity contract, or if EV charging is planned, the solar design and payback calculation may need to be updated before a final decision. Planning restrictions are significant. The calculator ignores finance, maintenance, and inverter replacement. The quoted system size is based on roof area only, not actual site demand. The proposal does not show assumptions for self-consumption and export.
How to choose an installer for a reliable payback estimate
For a commercial solar project, the installer should be able to explain both the financial model and the technical design. A credible proposal should not rely only on a generic calculator output. It should show assumptions, site constraints, system layout, generation estimate, self-consumption estimate, export treatment, and exclusions.
Look for evidence that the installer has considered the building as a working commercial site, not just as an empty roof. The survey should review roof access, roof condition, structural loading, cable routes, main switchgear, metering, fire safety, DNO requirements, monitoring, and maintenance access.
Important installer questions include the following. Modelling method: Ask whether the payback uses half-hourly consumption data or only annual electricity use. Export assumption: Ask what export rate has been used and whether the site has an export limit. Cost exclusions: Ask whether scaffolding, grid work, surveys, monitoring, roof works, and switchgear changes are included. Roof checks: Ask how structural suitability, roof condition, rooflights, and roof warranties will be handled. Maintenance plan: Ask what inspection, monitoring, cleaning assessment, and fault response are included. Finance assumptions: Ask whether interest, fees, tax treatment, and equipment replacement have been included. The lowest quote is not always the best commercial outcome. Poor connector compatibility, weak cable routing, inadequate labelling, unsuitable isolators, poor monitoring, or missing documentation can create safety, warranty, insurance, and performance problems later. A strong proposal should make the payback easy to challenge. If the annual saving seems high, the installer should be able to show exactly how much comes from avoided imports, how much comes from exports, what tariff has been used, and what has been deducted for maintenance or long-term costs. For UK businesses comparing business solar PV system options, this level of detail is often more useful than a single headline payback claim. System design — Ask why the proposed system size has been chosen and whether a smaller or larger option has been compared. Documentation — Ask what handover pack, warranties, test certificates, monitoring access, and DNO documents will be provided.
What a good calculator output should show
A good commercial solar payback calculator should make the result easy to audit. The business should be able to see what drives the payback, what assumptions have been used, and what could change after survey.
At minimum, the output should show:
Proposed system size in kWp. Estimated annual generation in kWh. Estimated solar electricity used on site. Estimated exported electricity. Import electricity rate used in the model. Export rate used in the model. For larger investments, it should also show cash flow, internal rate of return, net present value, finance costs, tax assumptions, and sensitivity analysis. Useful sensitivity checks include: These checks help avoid a business case that only works under optimistic assumptions. A practical calculator output might show one central estimate and two sensitivity cases. For example, the central case could use current electricity rates and expected self-consumption. A cautious case could assume lower self-consumption, lower export value, and higher maintenance. An upside case could include planned daytime EV charging or higher future daytime demand. This gives decision-makers a more balanced view than a single payback number. Commercial solar payback in the UK is ultimately site-specific. A calculator is a good starting point, but the most reliable decision comes from combining electricity data, roof and grid checks, realistic pricing, and a clear explanation of the assumptions behind the numbers. Annual bill saving from on-site use. Annual export revenue. Maintenance and monitoring allowance. Inverter replacement or long-term allowance. Net annual benefit. Net installed cost. Simple payback period. Key exclusions and assumptions. Lower electricity prices. Lower generation. Lower self-consumption. Lower export rates. Higher maintenance costs. Inverter replacement. Grid upgrade costs. Roof repair costs. Finance interest changes. Business operating-hour changes. EV charging or heat pump additions.
Plan, Compare & Buy Renewable Energy Solutions
AI does the thinking.
You get the perfect solar match.
Use RoboMo™ to assess your property, compare available technologies and connect with trusted UK installers, suppliers and manufacturers.
Simply enter your postcode, drop a pin on your roof, create your free account and let RoboMo™ analyse your property to find the best solar panels for your home.

You don't have to think
RoboMo™'s AI analyses your roof and does all the hard work.

Accurate & tailored
AI-powered assessment based on your roof, location, and conditions.

Best options, maximum savings
Compare top solar panels for the best performance and value.

Simple, fast & effortless
Provide a few details, sit back and watch your results unfold.


STEP 1
Choose Home, Business or Industrial
Enter your postcode to start your assessment.
STEP 2

Drop a pin on your roof
STEP 3

Create your free account
STEP 4

Sit back and watch RoboMo™ work
RoboMo™ analyses your roof and builds your personalised solar comparison.

Kilowatts UK is an authorised representative
Flower Turbines
Compact vertical-axis turbines built for real UK sites, not just open farmland.
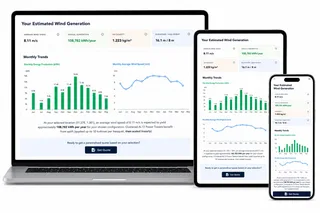
They start in light wind, sit in a small footprint, and are bird-safe by design. Cluster them as a bouquet and the group performs better together than the same turbines standing alone. Enter your postcode for a location-based generation estimate. Figures use area weather data and will differ if buildings, trees or hills sit in the way.
Starts in light UK wind
Built to generate in typical UK wind, not only open farmland.
Small rooftop or ground footprint
Compact towers for roofs, yards and tight sites.
Bird-safe slow rotation
Slow vertical-axis spin, bird-safe by design.
Bouquet clusters raise output
Grouped turbines outperform the same units standing alone.

Step 1
Enter your postcode
Start designing your wind energy system in seconds.
STEP 2

Choose a location
STEP 3

Place your cluster
Tap the map where you want the turbine cluster to go.
STEP 4

Instant generation forecasts
Compare different turbine layouts and see annual generation forecasts instantly.
STEP 5

No commitment required
Explore different configurations before deciding whether to request a quotation.
Related articles
Mo's Mission Nominations
FAQ
Need Help? RoboMo's Got Answers
What is a commercial solar payback calculator?
A commercial solar payback calculator estimates how long it may take for a UK business solar PV system to recover its net cost through electricity bill savings, export income, and any relevant finance or tax effects. It is useful as an early estimate, but it is not a final quote because payback depends on site-specific factors such as roof suitability, daytime electricity use, grid capacity, installation cost, maintenance, and export arrangements.
How is commercial solar payback calculated?
The basic calculation is net installed cost divided by annual net benefit. Net installed cost should include the full project cost after any confirmed grant or adjustment, while annual net benefit usually includes avoided grid electricity costs, export income, and relevant tax effects, minus maintenance, monitoring, finance, insurance, and long-term replacement allowances. For example, a system costing £80,000 with a net annual benefit of £12,000 would have a simple payback of about 6.7 years.
What is a typical commercial solar payback period in the UK?
Many UK commercial solar projects are often discussed in the 4 to 8 year simple payback range, but the actual result can be shorter or much longer. Sites with high daytime electricity demand, good roof conditions, limited shading, and minimal grid complications may achieve stronger payback. Sites with low self-consumption, expensive roof works, limited export capacity, or complex electrical upgrades may take longer.
What information do I need for an accurate commercial solar payback estimate?
The most useful inputs are 12 months of electricity bills, half-hourly consumption data, current import tariff details, operating hours, site address, roof information, and any planned changes such as EV charging, heat pumps, refrigeration, or process electrification. Half-hourly data is especially valuable because it shows when electricity is used, which helps estimate how much solar power will be consumed on site rather than exported.
Why does daytime electricity use matter so much?
Commercial solar usually gives the best financial return when the electricity is used directly by the business during daylight hours. This is because each unit of solar power used on site avoids buying electricity from the grid, which is normally worth more than exporting surplus electricity. A business with strong weekday daytime demand will often have a better payback than a business that mainly uses electricity in the evening or overnight.
Is it always best to fill the whole roof with solar panels?
No. Filling the roof is not always the most cost-effective design. A smaller system that closely matches the business’s daytime load can sometimes deliver a better return than a larger system that exports a high proportion of generation at a lower value. The best system size depends on electricity use, roof layout, grid limits, export terms, and project cost.
How much does commercial solar PV cost in the UK?
Commercial solar costs vary by system size, roof type, access requirements, grid connection, electrical complexity, and specification. As a broad guide, smaller commercial systems may cost around £900 to £1,500 per kWp, medium systems around £700 to £1,200 per kWp, and larger rooftop systems around £600 to £1,000 per kWp. These are broad market ranges only, and a final price requires survey, design, grid checks, and scope review.
Does export income improve commercial solar payback?
Export income can improve the business case, but it is usually less valuable than using solar electricity on site. Export rates vary and should not be assumed to match the business’s import electricity rate. Smaller eligible systems may use Smart Export Guarantee tariffs, while larger commercial systems may need a separate export agreement or power purchase arrangement.
Are there UK government grants or incentives for commercial solar?
The old UK Feed-in Tariff scheme closed to new applicants in 2019, so new commercial solar projects should not rely on it. Some local authorities, regional programmes, or net zero schemes may offer grants from time to time, but these are not universal and eligibility varies. A payback calculator should only include grant funding if the business is eligible and the funding is confirmed or realistically available.
How do tax and finance affect commercial solar payback?
Tax and finance can significantly change the payback result. A cash purchase, loan, lease, hire purchase, or power purchase agreement can each produce different cash flow and ownership outcomes. VAT recovery, capital allowances, corporation tax position, interest costs, fees, and contract terms should be checked with the business’s accountant or finance adviser before relying on a final payback figure.
Can roof condition change the payback calculation?
Yes. Roof condition can have a major effect on commercial solar payback. If the roof needs repair or replacement during the expected life of the solar system, it may be better to complete the roof work before installing panels. Removing and reinstalling solar panels later can add cost and disruption, which can weaken the investment case.
Can grid connection limits affect commercial solar payback?
Yes. Commercial solar projects normally need Distribution Network Operator approval, and larger systems commonly require a G99 application. If the local grid cannot accept the proposed export level without reinforcement, the project may need export limitation equipment, a smaller system, or additional grid costs. These factors can change both the system design and the payback period.
Do commercial solar panels need planning permission?
Many rooftop commercial solar installations may fall under permitted development rights, but this is not guaranteed. Listed buildings, conservation areas, scheduled monuments, designated land, ground-mounted systems, and some larger or more visible arrays may need closer review. Building regulations, electrical compliance, fire risk updates, insurer requirements, and landlord consent can still apply even where planning permission is not required.
Should battery storage be included in a commercial solar payback calculator?
Battery storage should usually be modelled separately. Batteries can improve self-consumption, support peak shaving, or help with tariff optimisation, but they do not automatically improve payback. Their value depends on the site’s load profile, tariff structure, cycling strategy, degradation, warranty limits, control software, and installed cost.
When might commercial solar not be suitable for a business?
Commercial solar may be less suitable if the business plans to move soon, has a short lease, cannot get landlord consent, has a roof near the end of its life, has severe shading, or uses very little electricity during daylight hours. It can also be challenging where export capacity is limited, grid reinforcement is expensive, or the electrical intake and switchgear need major upgrades.
What should a good commercial solar payback calculator show?
A good calculator should show the proposed system size, estimated annual generation, electricity used on site, exported electricity, import rate, export rate, bill savings, export income, maintenance allowance, long-term replacement assumptions, net annual benefit, net installed cost, and simple payback period. For larger projects, it should also include cash flow, finance costs, tax assumptions, net present value, internal rate of return, and sensitivity checks.
Why can two businesses with the same annual electricity use have different payback periods?
Annual electricity use does not show when the electricity is consumed. Two businesses may both use 500,000 kWh per year, but one may use most of it during daylight hours while another may use it mainly in the evening. The business with higher daytime demand is likely to use more solar power on site, export less, and achieve a stronger payback.
How can I tell if a commercial solar payback estimate is realistic?
A realistic estimate should clearly show its assumptions and should be based on actual electricity data wherever possible. It should separate avoided import savings from export income, include maintenance and long-term costs, explain the export rate used, and identify exclusions such as scaffolding, surveys, DNO work, roof repairs, switchgear upgrades, and monitoring. If a proposal only gives a headline saving without showing the underlying figures, it should be treated cautiously.