


Debunking the myth and revealing the truth about solar panel output in the UK
Published: 2026-07-25 16:01:18
Updated: 2026-08-01 09:06:26
Discover how much electricity your solar panels can generate, and what factors affect their performance.
How Much Electricity Do Solar Panels Generate in the UK?
Solar panel output in the UK is usually around 850–1,050 kWh per kWp per year, but that range is a starting point rather than a promise. A well-sited 4.0 kWp home solar system might generate roughly 3,400–4,200 kWh a year, while the same system on a shaded, awkward or less favourable roof could produce less.
The myth is that UK weather makes solar panels ineffective. The truth is more measured: UK solar panels generate useful electricity from daylight, including diffuse light on cloudy days, but output varies strongly by roof direction, shading, season, location and system design. Southern England is often closer to the upper end of typical yields; parts of northern England, Wales and Scotland may be lower, although the exact result depends on the individual site.
The kWp rating is not the same as annual generation. A 4.0 kWp system does not produce 4.0 kW all day. It means the system has a peak rating under standard test conditions, while real UK generation rises and falls through the day and across the seasons. If you are comparing system sizes for your own roof, you can compare home solar options before choosing a design route.
The Sources Behind UK Solar Output Estimates
The figures in this guide are practical UK planning ranges, not guaranteed production figures. They are consistent with the kind of outputs homeowners commonly see from UK installer modelling, European Commission PVGIS estimates, MCS-style calculation approaches and Energy Saving Trust guidance on domestic solar PV performance.
Good solar estimates use site-specific inputs rather than a national average. Public tools such as PVGIS can model solar irradiation for a postcode or map location, while MCS-certified installers should provide a calculation that reflects the property’s roof orientation, pitch, shading and system design. Energy Saving Trust guidance is also useful for explaining how domestic solar output relates to electricity use, export and savings.
For grid connection and export arrangements, installers should follow the relevant UK electricity network process. The Energy Networks Association publishes guidance used by Distribution Network Operators for small-scale generation connection routes, including G98 and G99 processes. Ofgem’s Smart Export Guarantee information explains the framework for paid export tariffs, although actual tariff terms are set by suppliers.
PVGIS
Useful for location-specific irradiation and annual yield modelling.MCS guidance
Relevant for domestic solar PV design, installation standards and performance estimates.Energy Saving Trust
Useful for consumer guidance on solar generation, self-consumption and practical household use.Energy Networks Association
Relevant for DNO connection processes such as G98 and G99.Ofgem Smart Export Guarantee
Relevant for understanding the export payment framework, not for predicting generation.
These sources do not remove the need for a proper roof survey. They help explain why a realistic quote should show its assumptions rather than simply stating a headline kWp size.
What Solar Panel Output Actually Means
Solar panel output is the amount of electricity a photovoltaic system generates. It is measured in kilowatt-hours, written as kWh. This is the same unit used on electricity bills, so it is the best way to understand how much useful energy a system produces over a day, month or year. Panel and system size are normally described in kilowatt-peak, written as kWp. This is a rating based on standard test conditions, not a promise of constant output. In normal use, panels generate less than their peak rating for much of the time because sunlight intensity, temperature, orientation, shading and inverter conversion all affect performance. For a clearer explanation of this rating, see what kWp means in solar. For most UK homeowners, expected annual generation is the most useful figure. Installers normally model this during system design, and actual performance can later be compared with monitoring data over months and years rather than judged from a single cloudy week.
| System size | Typical annual UK generation | Common property fit |
|---|---|---|
| 3.0–3.6 kWp | Around 2,550–3,780 kWh depending on site conditions | Smaller homes or roofs with limited usable space |
| 3.5 kWp | Around 3,000–3,700 kWh | Many smaller to medium homes |
| 4.0 kWp | Around 3,400–4,200 kWh | Common family home system size |
| 5.0 kWp | Around 4,250–5,250 kWh | Larger roofs or higher electricity demand |
A Worked Example for a Typical UK Home
A worked example helps show why kWp is only part of the answer. Imagine a 4.0 kWp domestic solar PV system on a largely unshaded, south-facing roof at around 35 degrees in southern England. Using typical UK yield assumptions, that system might generate about 3,800–4,200 kWh per year. Move the same 4.0 kWp system to an east-west roof and the annual total may be lower, but generation can be spread more evenly into the morning and afternoon. If the household uses electricity during those times, the practical value may still be strong. Add meaningful shading from a chimney, tree or neighbouring building, and the estimate should be reduced further unless the design properly accounts for that shade. A realistic comparison might look like this, assuming the same nominal system size but different roof conditions.
| Example 4.0 kWp system | Indicative annual generation | Why the result differs |
|---|---|---|
| South-facing, around 35 degrees, little shading, southern England | Around 3,800–4,200 kWh | Strong orientation, good pitch and higher regional irradiation |
| East-west split roof, limited shading, Midlands or similar | Around 3,300–3,900 kWh | Lower peak midday output but useful morning and afternoon generation |
| Partly shaded roof, mixed orientation or less favourable location | Around 2,800–3,500 kWh | Shade, orientation and local conditions reduce yield |
| Excellent south-facing roof in a lower-irradiation part of the UK | Around 3,400–3,900 kWh | Strong roof helps, but location and weather still affect annual output |
Why UK Solar Output Varies by Location
UK solar panel output is strongly affected by regional sunlight levels, but the pattern is not as simple as “south good, north bad”. Cornwall, Devon and much of southern England often achieve stronger annual yields than many inland or northern locations. Parts of Wales, Scotland and northern England vary significantly depending on elevation, exposure, cloud cover and the exact site.
This does not mean solar is ineffective outside the south. It means the yield estimate needs to reflect the property’s location. PVGIS-style modelling is useful here because it uses mapped solar irradiation rather than a single UK-wide average.
The UK’s climate is often misunderstood. Cloudy conditions reduce output, but they do not stop generation. Solar panels can use diffuse daylight, so they continue producing electricity even when the sky is overcast. Heavy cloud, short winter days and low sun angles have a bigger effect than cold weather itself. Cold weather is not the main problem for solar panels. In fact, panels can operate efficiently in cool conditions. Winter output is lower mainly because there are fewer daylight hours and the sun sits lower in the sky. This is why it helps to understand how solar works in winter before judging annual output from a few cold months.
Seasonal Output Is Not Evenly Spread
Solar generation changes heavily through the year. In the UK, a large share of annual output is produced between April and September, often around 65–75 percent of the total for many domestic systems. December and January are usually the weakest months. This seasonal pattern is consistent with UK solar irradiation data used in modelling tools such as PVGIS. It matters because solar panels may generate far more electricity than a household can use during bright summer days, while winter generation may cover only a smaller part of demand. Homes with high daytime use tend to benefit more directly from solar, while homes that use most electricity in the evening may export more unless they add battery storage. A simple way to think about seasonal generation is that summer output can be several times higher than winter output, depending on the roof, system size and weather.
| Season | Typical UK output pattern | Practical meaning for homeowners |
|---|---|---|
| Spring | Output rises quickly as days lengthen | Good balance between generation and household demand |
| Summer | Highest generation period for most systems | More surplus export is common unless daytime use or storage is high |
| Autumn | Output gradually falls as days shorten | Still useful, but less consistent than summer |
| Winter | Lowest generation period | Solar still works, but short days and low sun reduce output |
Roof Direction, Pitch and Shading Matter More Than Many People Expect
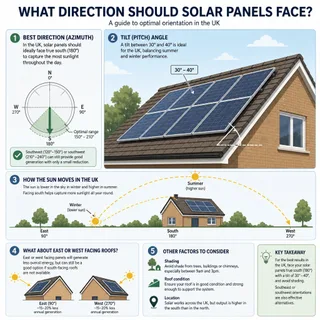
The roof is often the biggest performance factor after system size. South-facing roofs usually generate the most annual electricity in the UK. East-west roofs can still work well, especially where electricity use is spread across the morning and afternoon, but they typically generate less overall than a comparable south-facing roof. For more detail on this design choice, see the guide to solar panel direction. Roof pitch also matters. Around 30–40 degrees is generally a strong range for UK annual output, although slightly flatter or steeper roofs can still perform acceptably. Flat roofs often need mounting frames, spacing between rows and careful wind-loading design, so usable area may be less than it first appears. Shading is one of the most common causes of disappointing solar output. Even partial shade from a chimney, tree, dormer or neighbouring building can reduce generation more than homeowners expect, especially on a simple string inverter design.
| Factor | Typical effect on output | What to check early |
|---|---|---|
| South-facing roof | Usually highest annual generation | Clear roof area, pitch and shading |
| East-west roof | Often lower annual total but useful spread through the day | Morning and afternoon electricity use |
| North-facing roof | Usually unsuitable for strong generation | Whether another roof plane or mounting option is available |
| Shading | Can significantly reduce output | Trees, chimneys, dormers and nearby buildings |
| Roof condition | Does not change sunlight, but affects whether installation is sensible | Age, repairs, covering condition and access |
System Design and Equipment Losses
No solar PV system converts every bit of sunlight into usable household electricity. System losses are normal and are usually caused by inverter conversion, cabling, temperature effects, panel mismatch, soiling and other operating conditions. A practical allowance for system losses is often around 10–20 percent, but the correct value depends on the design and modelling method.
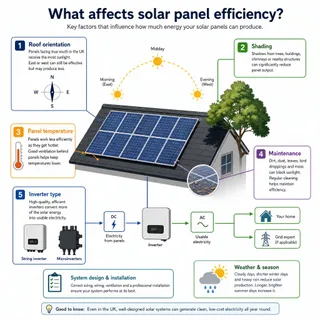
Modern monocrystalline panels are commonly used because they offer high efficiency, with many current domestic modules sitting around 20–23 percent efficiency under standard test conditions. Efficiency is useful where roof space is limited, but it is not the only specification that matters. A good layout, suitable inverter choice and good shading management can be just as important. If you are weighing panel specifications, it is worth checking what affects panel efficiency in real UK conditions.
Inverter choice should match the roof. A straightforward unshaded south-facing roof may suit a string inverter. More complex roofs, split orientations or partially shaded arrays may benefit from optimisers or microinverters, although suitability depends on design, budget and the level of shading.
Monitoring
Performance data helps compare actual generation with the installer’s estimate.Cable routes
Long or poorly planned cable runs can increase losses and complicate installation.Panel layout
Fire access requirements, roof obstructions and usable roof area can reduce the number of panels that fit.Inverter sizing
The inverter should be selected for the array design, roof orientation and expected generation profile.Shading strategy
Optimisers or microinverters may help in some shaded designs, but they do not turn a poor roof into an ideal one.
The best output estimates are based on the actual roof, not a generic system size. Two homes with the same number of panels can produce noticeably different annual generation.
How Much Electricity You Can Actually Use at Home
Generation and self-consumption are different things. Solar panels may generate thousands of kWh a year, but the amount used directly in the home depends on when electricity is needed. If the house is empty during the day and most usage happens in the evening, a larger share of solar electricity may be exported. A battery does not increase solar generation. It stores surplus electricity so more of the generated power can be used later. Typical home batteries are often sized around 5–10 kWh, but the right capacity depends on the solar array, household demand, tariff, backup expectations and budget. If storage is part of the plan, compare the role of capacity, inverter compatibility and solar battery costs before assuming a battery will suit every household. High daytime electricity use can improve the practical value of solar. This might include working from home, running appliances during daylight hours, heating hot water with surplus electricity where suitable, or charging an electric vehicle during the day. The design should be based on real usage patterns rather than an average household assumption.
| Household pattern | Likely solar use pattern | Design consideration |
|---|---|---|
| Someone home during the day | Higher direct self-consumption | Solar may offset more imported electricity directly |
| Most use in the evening | More daytime export without storage | Battery storage may be worth modelling |
| EV charging at home during daylight | Potentially high daytime use | Charger behaviour and available solar surplus matter |
| Heat pump or electric hot water use | Demand may be significant but seasonal | Controls and timing affect how much solar is used |
The UK Climate Myth
One of the biggest myths is that solar panels are not worthwhile in the UK because the weather is too cloudy. In reality, UK solar output is lower than it would be in sunnier countries, but it is still predictable enough for proper system design. The key is using realistic estimates.
Solar panels produce electricity from daylight, not just direct sun. A cloudy day will generate less than a clear day, but generation does not fall to zero simply because the sun is hidden. Winter output is lower mainly because the days are shorter, the sun is lower and poor weather is more frequent. A simple overview of how solar works can help separate daylight generation from the myth that panels need constant hot sunshine.
Another misconception is that a panel’s peak rating tells you what it will produce most of the time. It does not. The kWp rating is useful for comparing system sizes, but annual kWh generation is the more meaningful figure for homeowners.
Common Mistakes When Estimating Solar Output
A reliable output estimate needs to be property-specific. Online averages are helpful for a first impression, but they should not replace a proper roof assessment and system design.
The most common mistakes are usually practical rather than technical. Homeowners may focus on panel wattage while overlooking shading, roof condition, cable routes or whether the household can use the electricity when it is generated.
- Comparing panel wattage without checking the full system design.
- Ignoring shade from chimneys, trees or nearby buildings.
- Assuming summer generation reflects the whole year.
- Forgetting that batteries store energy but do not create more generation.
- Installing on an ageing roof without considering future roof repairs.
- Treating a generic UK average as a guarantee for a specific property.
A good installer should explain the assumptions behind the estimate, including roof orientation, pitch, shading, local irradiation, inverter choice and system losses. Comparing quotes without checking whether the generation assumptions are the same. Looking only at annual output rather than when the electricity is produced.
Grid Connection, Export and System Size
Larger solar systems can be more productive, but system size is not only a roof-space decision. The local electricity network and export arrangement can affect what is practical. Many UK homes are connected to a local Distribution Network Operator, and the installer should confirm the relevant connection route before or during the design process.
For small-scale domestic generation, installers commonly deal with ENA connection processes such as G98 or G99, depending on the system and connection circumstances. The details should be confirmed for the specific property and equipment, because export limits, inverter settings and DNO requirements can vary.
This does not mean larger systems are impossible. It means the installer may need to consider export capacity, any DNO approval needed, whether export limitation is appropriate, and how a battery or hybrid inverter affects the design. The right approach depends on the property and the local network. For homeowners, the practical question is not just “how many panels fit?” It is “how much generation can the property use, export and connect safely within the relevant approval process?”
Smart Export Guarantee and Exported Solar Electricity
Not all generated electricity is used in the home. When solar panels produce more power than the property is using, the surplus may be exported to the grid if the installation and metering arrangements allow it.
Ofgem’s Smart Export Guarantee framework requires certain licensed suppliers to offer an export tariff to eligible small-scale low-carbon generators, including solar PV. This framework is about payment for exported electricity, not about how much electricity the panels generate. Export tariff rates and eligibility details vary by supplier and can change, so they should be checked before making financial assumptions.
Export income should be treated separately from generation. A system can generate well but export a large share if the home has low daytime demand. Conversely, a home with high daytime demand may export less but use more solar electricity directly.
When Solar Panels May Not Be Suitable
Solar is a strong option for many UK homes, but it is not right for every property. The best candidates usually have a structurally sound roof, limited shading and a sensible route for electrical equipment and cabling.
A heavily shaded roof, a mainly north-facing roof or a roof likely to need major repairs soon can make solar less attractive. Flats without roof ownership or practical roof access are also more complicated. In these cases, the issue is often not whether panels can generate electricity, but whether the installation is practical, efficient and worth the disruption.
Solar suitability should be judged on usable roof area, roof condition and remaining lifespan, orientation, pitch, shading throughout the year, electrical layout, connection requirements and household electricity demand.
Heavy shading
Persistent shade from trees, buildings or roof features can reduce output and complicate the design.Limited access
Difficult access can affect installation practicality and maintenance.Roof condition
If the roof may need major repairs soon, it can be sensible to deal with that before installing panels.Weak orientation
A mainly north-facing roof is usually less attractive for strong annual generation.Ownership constraints
Leasehold properties, flats and shared roofs may need permissions before any technical design is useful.
If any of these points are weak, the system may need redesigning, reducing in size or delaying until roof repairs are complete.
What a Realistic Solar Output Estimate Should Include
A useful UK solar estimate should show expected annual generation in kWh, not only the installed kWp size. It should also explain the assumptions behind the figure so the homeowner can understand why the estimate is credible.
The estimate should consider the real roof layout, the panel model, inverter arrangement, shading, system losses and expected regional generation. It should also separate total generation from the amount likely to be used on site, because those figures answer different questions.
A practical estimate should include the main design and performance assumptions rather than only a headline savings figure. Installed system size in kWp. Expected annual generation in kWh. Roof orientation, pitch and shading assumptions. Local irradiation or location-based modelling assumptions. Panel model and inverter arrangement. System loss allowance. Once the system is installed, monitoring data should be used sensibly. A single cloudy week does not prove underperformance, but actual generation over time can be compared with the original estimate. Likely seasonal variation. Battery assumptions if storage is included. Expected self-consumption and export assumptions. Any relevant DNO or export limitation considerations.
How to Sense-Check a Solar Quote
A good solar quote should make its generation estimate understandable. You do not need to become a solar engineer, but you should be able to see why the proposed system is expected to generate a particular amount of electricity.
The most useful check is to compare the kWh per kWp figure. If a quote says a 4.0 kWp system will generate 4,000 kWh a year, that implies 1,000 kWh per kWp. That may be realistic for a strong UK site, but it should be supported by the roof conditions and modelling assumptions. If another quote shows a much higher or lower figure, ask why.
You should also check whether the quote separates generation, self-consumption, export and savings. Generation is a physical output estimate. Savings depend on household behaviour, tariff assumptions, export rates and whether battery storage is included. Ask what yield per kWp has been assumed. Ask what shading assessment has been used. Ask whether the roof pitch and orientation are based on measurement or assumption. Ask what system loss allowance is included. Ask whether the estimate uses location-specific irradiation data. Ask how much electricity is expected to be used on site rather than exported. If the answers are vague, the output figure should be treated cautiously. Ask what DNO process or export limitation may apply.
The Bottom Line on UK Solar Panel Output
In the UK, a well-designed solar PV system typically generates around 850–1,050 kWh per kWp each year. For common domestic systems, that means roughly 3,000–3,700 kWh from a 3.5 kWp system, 3,400–4,200 kWh from a 4.0 kWp system, and 4,250–5,250 kWh from a 5.0 kWp system.
The real answer depends on the roof, location, shading, system design, inverter choice and how the household uses electricity. UK weather does reduce output compared with sunnier countries, but it does not make solar ineffective.
The most trustworthy estimate is not the most optimistic one. It is the one that explains its assumptions, uses the actual roof, accounts for shading and local irradiation, and separates annual generation from the electricity the household is likely to use directly.
Plan, Compare & Buy Renewable Energy Solutions
AI does the thinking.
You get the perfect solar match.
Use RoboMo™ to assess your property, compare available technologies and connect with trusted UK installers, suppliers and manufacturers.
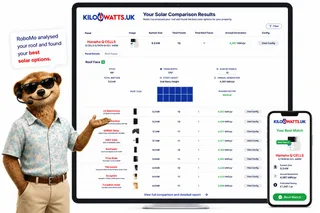
Simply enter your postcode, drop a pin on your roof, create your free account and let RoboMo™ analyse your property to find the best solar panels for your home.

You don't have to think
RoboMo™'s AI analyses your roof and does all the hard work.

Accurate & tailored
AI-powered assessment based on your roof, location, and conditions.

Best options, maximum savings
Compare top solar panels for the best performance and value.

Simple, fast & effortless
Provide a few details, sit back and watch your results unfold.
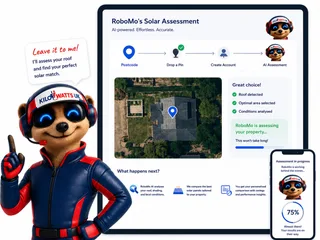
STEP 1
Choose Home, Business or Industrial
Enter your postcode to start your assessment.
STEP 2

Drop a pin on your roof
STEP 3

Create your free account
STEP 4

Sit back and watch RoboMo™ work
RoboMo™ analyses your roof and builds your personalised solar comparison.

Kilowatts UK is an authorised representative
Flower Turbines
Compact vertical-axis turbines built for real UK sites, not just open farmland.
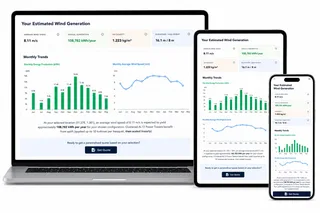
They start in light wind, sit in a small footprint, and are bird-safe by design. Cluster them as a bouquet and the group performs better together than the same turbines standing alone. Enter your postcode for a location-based generation estimate. Figures use area weather data and will differ if buildings, trees or hills sit in the way.
Starts in light UK wind
Built to generate in typical UK wind, not only open farmland.
Small rooftop or ground footprint
Compact towers for roofs, yards and tight sites.
Bird-safe slow rotation
Slow vertical-axis spin, bird-safe by design.
Bouquet clusters raise output
Grouped turbines outperform the same units standing alone.

Step 1
Enter your postcode
Start designing your wind energy system in seconds.
STEP 2

Choose a location
STEP 3

Place your cluster
Tap the map where you want the turbine cluster to go.
STEP 4

Instant generation forecasts
Compare different turbine layouts and see annual generation forecasts instantly.
STEP 5

No commitment required
Explore different configurations before deciding whether to request a quotation.
Related articles
Solar panels
Mo's Mission Nominations
FAQ
Need Help? RoboMo's Got Answers
What factors affect solar panel power output?
The amount of electricity generated by solar panels depends on several factors, including system size, orientation, and quality of the panels. In the UK, a typical domestic solar panel installation can generate between 350-400 watts per square meter of installed surface area.
How much electricity do solar panels typically generate in the UK?
A well-designed and installed domestic solar panel system in the UK can generate around 600-800 kWh per year. This is equivalent to the energy consumption of a small to medium-sized household. However, this figure can vary significantly depending on your specific system design and local weather patterns.
What are typical solar panel system sizes?
Solar panel systems come in various sizes, including small, medium, and large systems. Small systems (typically suitable for tiny homes or small apartments) produce around 1-3 kW of power. Medium systems (suitable for average-sized homes) generate around 4-10 kW, while large systems (suited for commercial properties) can produce up to 50 kW or more.
How long do solar panels typically last?
Solar panels are designed to withstand harsh weather conditions and maintain their performance over time. On average, a well-maintained solar panel system can last for around 25-30 years, with some systems lasting even longer.
Can you provide more information on factors affecting solar panel performance?
Yes, certain factors can affect the performance of your solar panel system, including shading, dirt and debris, weather patterns, and maintenance. It's essential to regularly clean and inspect your solar panels to ensure optimal energy production.
How do I get started with a solar panel installation?
To get started with your solar panel installation, book a free home energy survey today. Our expert team will assess your property and provide you with personalized recommendations for your specific needs.