


How much electricity does a solar panel produce?
Published: 2026-07-19 08:06:31
Updated: 2026-08-01 13:16:08
2 kWh per day averaged across the year. The important point is that the watt rating on the panel is not what it will produce continuously.
How much electricity does a solar panel produce?
A typical modern domestic solar panel in the UK is often rated at around 400W to 500W. In real UK conditions, one well-sited panel might generate roughly 320 to 500 kWh a year, which averages about 0.9 to 1.4 kWh per day across the year. That daily figure is an annual average, not what you should expect every day. The exact output depends on the panel rating, roof direction, pitch, shading, location, temperature, inverter design, and the quality of the layout. A south-facing, largely unshaded roof in southern England will usually perform differently from a shaded or east-west roof in a less sunny region. Winter days may produce very little compared with bright spring and summer days. The most reliable estimate is normally made at whole-system level, not by looking at a single panel in isolation. Installers should base a forecast on recognised calculation principles, such as MCS-style performance estimation, PVGIS or similar solar irradiation modelling, SAP assumptions where relevant, roof measurements, shading assessment and manufacturer datasheets. If you are weighing up roof space, panel count and system size, compare home solar options against your actual usage rather than relying on one panel figure.
| Panel rating | Typical UK annual output per panel | Average daily output across the year | Assumption behind the estimate |
|---|---|---|---|
| 400W panel | Around 320 to 400 kWh | Around 0.9 to 1.1 kWh per day | Based on roughly 800 to 1,000 kWh per kWp per year |
| 450W panel | Around 360 to 450 kWh | Around 1.0 to 1.2 kWh per day | Based on roughly 800 to 1,000 kWh per kWp per year |
| 500W panel | Around 400 to 500 kWh | Around 1.1 to 1.4 kWh per day | Based on roughly 800 to 1,000 kWh per kWp per year |
Watts, kilowatts and kilowatt-hours explained
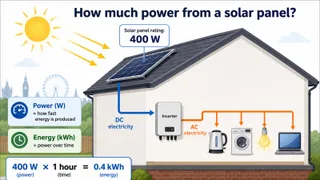
Solar panel output is often confusing because people use power and energy as if they are the same thing. Power is the instant output at a particular moment, measured in watts or kilowatts. Energy is what has been produced or used over time, measured in kilowatt-hours.
A panel’s watt rating is a peak laboratory rating, usually measured under Standard Test Conditions in a manufacturer datasheet. It is useful for comparing panels, but it is not a promise that the panel will produce that output throughout the day. UK weather, sun angle, shading, roof direction and system design all affect the final kWh total.
This distinction matters because your electricity bill is based on kilowatt-hours. If a solar panel system produced 1 kW continuously for one hour, that would be 1 kWh of electricity. In practice, solar generation rises and falls minute by minute, so annual kWh is the figure that matters most. It also helps to understand what kWp means when comparing system sizes and panel ratings.
kWp
The combined peak rating of the panels in the array.Watts
The instant power output at a specific moment.Kilowatts
One thousand watts, often used for the size of a solar array or inverter.Peak rating
The controlled-test rating used to compare panels, not a constant real-world output.Annual yield
The estimated amount of energy a panel or system should produce over a year.Kilowatt-hours
The amount of electricity generated or used over time.
This is why a 450W panel should not be estimated by multiplying 450W by every daylight hour in the year. Its real output depends on how much usable sunlight reaches it and how the system converts that sunlight into electricity.
A simple way to estimate solar panel generation
A useful first estimate starts with the size of the array in kWp, then applies an expected UK annual yield. For many domestic UK roofs, a broad planning range of around 800 to 1,000 kWh per kWp per year is a sensible starting point before detailed survey results are available.
The basic calculation is simple: panel rating multiplied by panel count gives the system size in kWp, then system size multiplied by expected yield per kWp gives annual generation. This is only a planning estimate. A proper forecast should adjust for roof pitch, orientation, shading, local irradiation and equipment design.
For example, ten 450W panels create a 4.5 kWp array. If the roof is suitable and the expected yield is 850 to 950 kWh per kWp per year, the estimated annual generation would be about 3,825 to 4,275 kWh. Averaged across a year, that is roughly 10.5 to 11.7 kWh per day for the whole system, although summer days may be much higher and winter days much lower. Step one: Convert the panel rating into kilowatts by dividing watts by 1,000. Step two: Multiply by the number of panels to get the array size in kWp. Step three: Multiply the kWp by a realistic UK yield assumption. Step four: Adjust the estimate for roof direction, pitch, shading and location. Step five: Compare the expected generation profile with your household electricity use. This method is more reliable than treating one panel’s rating as a daily production figure. It also helps you compare quotes because you can see whether a higher output forecast is backed by better site conditions or simply a more optimistic assumption.
Why UK solar output changes through the year
In the UK, solar panels usually produce far more electricity in spring and summer than in the darker winter months. Longer daylight hours, a higher sun path and brighter conditions all help generation. In winter, panels still work, but shorter days and lower sun angles reduce output. For a broader view of seasonal and annual output, see how UK solar generation is typically discussed.
Cloud does not stop a solar panel from working. Panels can still generate electricity in diffuse light, but output is lower than in direct sun. That is why an annual average is useful for estimating production, but less useful for predicting what will happen on a specific day.
Regional differences also matter. Southern parts of the UK generally receive more usable sunlight than northern areas, but roof layout and shading can be just as important as location. A lightly shaded, well-orientated roof further north may outperform a compromised roof elsewhere. The seasonal pattern also affects how much of the electricity you can use at home. A system may generate more than the property needs on some bright summer days, then much less than demand during winter evenings. That timing is central to battery decisions, export expectations and whether flexible loads such as appliances, EV charging or immersion heating can be shifted into solar hours.
The main factors that affect solar panel production
Solar panel output is shaped by site conditions and system design. A good installer will assess the roof as a working electrical asset, not just count how many panels can physically fit. The table below summarises the main factors that decide how much electricity a solar panel or array is likely to produce.
| Factor | Why it matters | What to check early |
|---|---|---|
| Panel rating | Sets the potential peak output of each panel | Compare ratings alongside warranty, size and suitability |
| Roof orientation | Affects how much sunlight reaches the panels during the day | Check the direction of each roof plane, not just whether it is south-facing |
| Roof angle | Influences seasonal performance and annual yield | Consider whether the roof pitch suits the array design |
| Shading | Even partial shade can reduce output from affected panels | Look for trees, chimneys, dormers, aerials and neighbouring buildings |
| Location | UK sunlight levels vary by region | Use a site-specific estimate rather than a national assumption |
| System design | Inverter choice and array layout affect usable generation | Ask how strings, optimisers, inverter sizing and monitoring are handled |
| Usage pattern | Solar is most valuable when you can use it as it is produced | Compare daytime electricity use with expected generation |
How many panels do you need?
The number of panels you need depends on your electricity use, suitable roof space, panel rating and the purpose of the system. A household with low daytime use may need a different design from a home with an electric vehicle, heat pump, home working pattern or battery.
Panel count also depends on the physical size and rating of the modules selected. Higher-rated panels can increase capacity on a limited roof, but they still need safe layout, suitable mounting, electrical compatibility and an inverter design that matches the array. If you are trying to sense-check the likely scale of an installation, this guide to panels your home needs is a useful next step.
As a rough example, eight 450W panels would create a 3.6 kWp system. Using a broad UK yield range of 800 to 1,000 kWh per kWp per year, that might suggest around 2,880 to 3,600 kWh a year before more detailed site adjustments. Twelve 450W panels would create a 5.4 kWp system, with a broad planning estimate of around 4,320 to 5,400 kWh a year under the same assumptions. It is usually better to size the system from your electricity demand and roof survey rather than start with a fixed number of panels. A realistic design should consider your annual electricity use, daytime demand, available unshaded roof space and whether you may add a battery later. It should also account for heat pump or electric vehicle plans, plus any roof condition or access issues that could affect installation. A larger system is not automatically the best system. If export capacity is constrained, roof areas are heavily shaded, or the property uses very little electricity during the day, the best answer may be a smaller array, a battery-ready design, or a phased approach.
What happens to electricity you do not use?
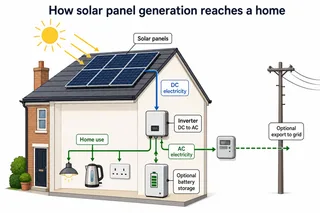
Solar electricity is used first by the property while the system is generating. If the panels are producing less than the building needs, the property imports the difference from the grid. If the panels are producing more than the building is using, the surplus may charge a battery if one is installed or be exported to the grid.
This timing is one of the most overlooked parts of solar performance. A system can generate a healthy annual total but still export much of it if the home is empty during the day and has no battery or flexible loads. A household with daytime appliances, smart controls, immersion diversion, EV charging or battery storage may use more of its own generation.
A battery does not make panels produce more electricity. It changes when the electricity can be used. That can improve self-consumption, but the right battery size depends on generation profile, household demand, tariff arrangements, available space and budget. If storage is part of your thinking, review solar battery costs alongside the generation estimate. Export should also be considered realistically. A quote may show strong annual generation, but the financial value depends on how much electricity is used on site, how much is exported, and the tariff arrangements available to the household. Those are separate from the panel’s physical ability to generate electricity.
Common mistakes when estimating solar output
Many poor solar expectations come from treating the panel rating as if it were the amount of electricity produced every hour. A 450W panel is not a 450W generator running at full power from sunrise to sunset. It is a panel with a peak rating under controlled test conditions.
Another common mistake is relying on a roof’s general direction without checking individual obstructions. Chimneys, soil vent pipes, roof windows, dormers, trees, parapets and neighbouring buildings can all change the result. The best designs account for the exact roof, not an idealised version of it. Orientation still matters, so it is worth understanding which direction panels face before comparing different roof planes.
- Confusing watts with kilowatt-hours.
- Multiplying peak watts by daylight hours.
- Assuming output is constant through the day.
- Ignoring winter generation when judging self-sufficiency.
- Forgetting that shade can move across the roof during the year.
- Comparing panel ratings without checking the full system design.
It is also worth thinking about roof age. If a roof may need major work soon, it can be more practical to deal with that before installing panels, because removing and reinstalling an array later adds disruption and cost. Expecting a battery to increase generation rather than shift usage. Accepting a headline annual forecast without asking what assumptions were used.
How installers estimate likely generation
A competent solar installer should estimate output using the property details, roof measurements, orientation, pitch, local conditions and shading. The estimate should be presented as a forecast rather than a guarantee, because weather and usage patterns vary from year to year.
Recognised approaches usually combine panel datasheet ratings with irradiation data, roof geometry and loss assumptions. In the UK, this may involve MCS performance estimate principles, PVGIS or comparable solar modelling, SAP-related assumptions where appropriate, and software that accounts for roof direction, pitch and shading. The important point is that the calculation should be traceable and specific to the proposed design.
Installer judgement matters most where the roof is not simple. Multiple roof planes, partial shade, different orientations, limited loft access, unusual roof coverings, conservation areas or electrical constraints can all affect the final design. The strongest quote is not always the one with the highest headline generation figure. Good questions to ask include whether the design accounts for shade, how panels are grouped electrically, where the inverter will be installed, whether monitoring is included, and how future additions such as a battery, EV charger or heat pump would affect the specification. If you want a site-specific starting point, you can book a free survey before making a decision.
Is one solar panel enough to matter?
One solar panel can produce useful electricity, but domestic solar is normally designed as an array because a single panel will only cover a small part of a property’s energy use. A modern panel producing around 320 to 500 kWh a year can still be meaningful, but it will not usually transform a household bill on its own.
For small applications, a single panel may make sense in limited off-grid or specialist uses. Most UK homes and businesses considering rooftop solar should focus on whole-system annual generation, self-consumption and timing. Those factors affect bills, battery suitability, export behaviour and payback expectations more than the output of one panel in isolation.
The practical answer is that a typical UK domestic solar panel might average roughly 0.9 to 1.4 kWh per day over a full year, depending mainly on its rating and site conditions. Use that as a cautious sense-check, then rely on a roof-specific design and generation forecast before making buying decisions.
Plan, Compare & Buy Renewable Energy Solutions
AI does the thinking.
You get the perfect solar match.
Use RoboMo™ to assess your property, compare available technologies and connect with trusted UK installers, suppliers and manufacturers.
Simply enter your postcode, drop a pin on your roof, create your free account and let RoboMo™ analyse your property to find the best solar panels for your home.

You don't have to think
RoboMo™'s AI analyses your roof and does all the hard work.

Accurate & tailored
AI-powered assessment based on your roof, location, and conditions.

Best options, maximum savings
Compare top solar panels for the best performance and value.

Simple, fast & effortless
Provide a few details, sit back and watch your results unfold.

STEP 1
Choose Home, Business or Industrial
Enter your postcode to start your assessment.
STEP 2

Drop a pin on your roof
STEP 3

Create your free account
STEP 4

Sit back and watch RoboMo™ work
RoboMo™ analyses your roof and builds your personalised solar comparison.

Kilowatts UK is an authorised representative
Flower Turbines
Compact vertical-axis turbines built for real UK sites, not just open farmland.
They start in light wind, sit in a small footprint, and are bird-safe by design. Cluster them as a bouquet and the group performs better together than the same turbines standing alone. Enter your postcode for a location-based generation estimate. Figures use area weather data and will differ if buildings, trees or hills sit in the way.
Starts in light UK wind
Built to generate in typical UK wind, not only open farmland.
Small rooftop or ground footprint
Compact towers for roofs, yards and tight sites.
Bird-safe slow rotation
Slow vertical-axis spin, bird-safe by design.
Bouquet clusters raise output
Grouped turbines outperform the same units standing alone.

Step 1
Enter your postcode
Start designing your wind energy system in seconds.

STEP 2

Choose a location
STEP 3

Place your cluster
Tap the map where you want the turbine cluster to go.
STEP 4

Instant generation forecasts
Compare different turbine layouts and see annual generation forecasts instantly.
STEP 5

No commitment required
Explore different configurations before deciding whether to request a quotation.
Related articles
Mo's Mission Nominations
FAQ
Need Help? RoboMo's Got Answers
How much electricity does one solar panel produce in the UK?
A modern solar panel in the UK typically produces about 260 to 495 kWh of electricity per year, depending on its rating and the installation conditions. A common 400W panel usually produces around 300 to 440 kWh per year, which averages roughly 0.8 to 1.2 kWh per day across the year.
Does a 400W solar panel produce 400W all the time?
No. A 400W panel is rated at 400 watts under standard test conditions, which represent ideal laboratory conditions. In real UK weather, output rises and falls throughout the day depending on sunlight, cloud, shading, roof angle, temperature and system losses. The more useful figure for bills and savings is annual generation in kWh.
How much electricity does a 400W solar panel produce per day?
A 400W solar panel in the UK usually averages about 0.8 to 1.2 kWh per day over a full year. On a strong summer day it may generate around 1.5 to 2.5 kWh, while on a dull winter day it may produce around 0.2 to 0.8 kWh or less.
How much electricity does a full home solar panel system produce?
A typical UK home solar system of around 3.5kWp to 4.5kWp may produce roughly 2,800 to 4,500 kWh per year, depending on the roof and location. For example, a 4kWp system made from about ten 400W panels may generate around 3,000 to 4,400 kWh per year on a suitable roof.
What is the difference between W, kW, kWh and kWp?
Watts and kilowatts measure power at a moment in time, while kWh measures energy generated or used over time. A solar panel’s watt rating, such as 400W, shows its peak rated output. kWp means kilowatt peak and describes the combined peak rating of the panels in a system. kWh is the unit used on electricity bills and is the key figure for solar generation estimates.
What affects how much electricity solar panels produce?
The main factors are roof direction, roof pitch, shading, panel rating, location, inverter design and system losses. In the UK, an unshaded south-facing roof usually produces the highest annual output, but east-facing and west-facing roofs can still work well. Shading from trees, chimneys, dormers or nearby buildings can reduce output significantly.
Do solar panels work on cloudy days?
Yes. Solar panels still generate electricity on cloudy days because daylight reaches the panels, but output is lower than in bright direct sun. Very dull days can produce much less electricity, while cold sunny days can be productive because solar panels do not need hot weather to work.
Do solar panels produce much electricity in winter?
Solar panels produce electricity in winter, but output is much lower than in spring and summer. Shorter daylight hours, a lower sun angle and more overcast weather reduce generation. December and January are usually among the weakest months for UK solar output.
How many solar panels are needed to power a home?
The number of panels depends on the home’s electricity use, roof space, roof direction, shading and whether the household can use electricity during the day. As a broad guide, a medium-use UK home may consider a 3kWp to 4kWp system, often around 8 to 10 modern panels. Matching annual generation to annual usage does not mean the home will avoid grid electricity completely, because solar output and household demand do not always happen at the same time.
Can solar panels remove my electricity bill completely?
Solar panels can reduce electricity bills, but they rarely remove them completely. Homes still use electricity at night, in poor weather and during winter when solar output is lower. Standing charges also remain. A battery, smart controls or daytime electricity use can increase the amount of solar electricity used in the home, but most homes still import some power from the grid.
Does a battery increase solar panel output?
No. A battery does not make solar panels generate more electricity. It stores surplus solar electricity that would otherwise be exported to the grid, allowing the home to use more of its own solar power later in the evening or overnight. This can improve self-consumption, but it does not increase the panels’ annual kWh generation.
Why does solar output vary so much by season?
UK solar output is highly seasonal because daylight hours and sun angle change throughout the year. A system can generate several times more electricity in June than in December. This is especially important for homes with heat pumps or electric vehicles, because electricity demand may be higher at times when solar output is lower.
How do I estimate solar panel output for my roof?
A rough estimate is to multiply the system size in kWp by an expected UK yield, often around 750 to 1,100 kWh per kWp per year for a suitable site. For example, a 4kWp system at 900 kWh per kWp would generate about 3,600 kWh per year. A proper estimate should also account for roof orientation, pitch, shading, usable roof area, inverter design, system losses and local irradiation.
Why might solar panels produce less than expected?
Solar panels may produce less than expected if the roof is shaded, the orientation or pitch is less favourable, panels are dirty or obstructed, the inverter design is unsuitable, monitoring is incorrectly configured, or the system is export-limited. Output can also fall if nearby trees grow and create new shading. A realistic survey and ongoing monitoring help identify these issues.
Is a south-facing roof required for solar panels in the UK?
No. A south-facing roof usually gives the highest annual output in the UK, but east-facing and west-facing roofs can still be effective. East-facing panels generate more in the morning, while west-facing panels generate more in the afternoon. The best design depends on roof space, shading, household usage patterns and the overall system layout.