Need help right now?
Talk to RoboMo™ and get instant answers.


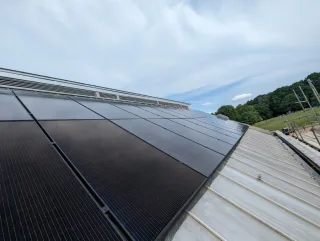
Berkshire combines commuter towns, historic market centres, and pockets of open countryside, creating a varied environment for solar installation. Locations such as Reading, Slough, and Newbury present different housing densities, which directly influence how systems are designed. Real comparison data from installations across Berkshire shows strong adoption in semi-detached and detached homes where roof space allows flexible panel layouts.
System performance across Berkshire is shaped by a mix of roof orientation, tree cover, and neighbouring buildings. Urban areas tend to introduce shading constraints, while properties in less dense parts benefit from clearer exposure. This variation means careful system design is essential to achieve consistent output across the region.
Savings in Berkshire depend on how well a solar system matches household energy usage. Homes that use electricity during the day benefit more directly, while others rely on battery storage to increase self-consumption.
Based on real comparison data, households typically see savings from £342 up to £1239, with most achieving around £790 annually depending on system design and usage patterns.
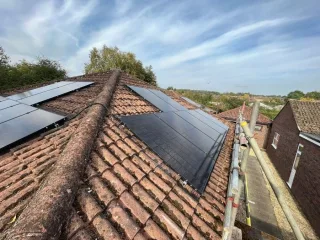
Housing across Berkshire ranges from compact terraced streets in towns like Reading to larger detached homes in suburban and rural areas. This affects how many panels can be installed and how systems are configured to fit available roof space.
In more built-up areas, roof obstructions such as chimneys and adjacent buildings can limit panel placement. Installers typically adjust layouts and use optimisers where needed to reduce the impact of partial shading.
Solar generation in Berkshire is influenced by roof direction, shading, and system size. South-facing roofs usually deliver the highest output, while east-west systems spread generation more evenly throughout the day.
Typical systems generate around 3593 annually, with well-optimised setups reaching 5630. Most homes install approximately 10 panels, adjusted to suit roof space.
Local comparisons
2
Real comparison activity from this area
Typical generation
3593 kWh
Average projected yearly output
Best recorded result
5630 kWh
Top projected generation in your local dataset
Typical system size
10 panels
Average setup size being compared nearby
The fastest way to find out what your roof could do
Start your solar comparison and get a roof-specific estimate based on your roof shape, property type, and best installation fit.
Get a local solar estimate in seconds
Speak to a real solar expert
Compare solar and if you install through our partner you get a Free Mo CEO cuddly toy. Tems and conditions apply

Berkshire solar opportunity score
Based on real comparison activity, system performance, and local demand signals.
Why Berkshire scores this level
Based on current data, properties in Berkshire are typically generating around 3593 kWh per year from solar installations.
Local comparison activity shows an average system size of 10 panels, with strong potential savings across the area.
The opportunity score reflects a combination of:
Planning rules in Berkshire are generally straightforward under permitted development, but properties in conservation areas such as parts of Windsor or listed buildings may require approval. Visual impact and placement on front-facing roofs are common considerations.
Most standard installations proceed without formal permission, although installers will assess any restrictions before work begins to ensure compliance.
Observed installation trends in Berkshire show a preference for medium-sized systems that align with household electricity demand. Many properties are now pairing solar with battery storage to capture excess generation and use it during evening hours.
Local installation data highlights that properties with simple roof structures tend to achieve more efficient layouts, while complex roof designs require tailored system planning to maintain performance.
This map highlights where solar comparisons are happening locally. Brighter areas indicate higher demand for solar panel installation.
Typical system sizes in Berkshire
Estimated savings distribution
Annual generation distribution
Estimated return over time
Solar interest trend in Berkshire
Average system size
10 panels
Based on current local comparison activity.
Most common panel class
400W
Derived from the strongest panel entries in the local dataset.
Best recorded generation
5630 kWh
Highest projected annual generation currently in the local page data.
Roof orientation
0% south
East/West: 100%
Mixed: 0%
Flat: 0%
What people in Berkshire want
This data comes from real residential solar comparisons in Berkshire, showing how different system sizes and panel types perform across local homes.
If you are planning Home solar panel installation in Berkshire, these insights help you understand what system sizes are being compared and what generation levels are achievable.
Based on real comparison activity from properties in this area.
| Panel type | Typical setup | Avg annual generation |
|---|---|---|
| 16 panel system High-efficiency panel | 16 panels | 5630 kWh |
| 4 panel system High-efficiency panel | 4 panels | 1555 kWh |
See what your Residential roof could generate in Berkshire
Choose property type
Tailor the estimate to the property.
See likely generation and savings
Then request quotes or book an appointment.
Estimated fit: 10 panels
Likely annual generation: 3593 kWh
Possible yearly savings: £790 / year
Find out what is best for your setup fast!
Speak to a real solar expert
36 MacDonald Rd, Lightwater GU18 5TN, UK


1 Chalfont Park, Chalfont St Peter, Gerrards Cross SL9 0BG, United Kingdom SL9 0BG

Anglo Business Park, Unit 11 Asheridge Rd, Chesham HP5 2QA, United Kingdom HP14 3SX

Most homes in Berkshire generate around 3593 kWh per year, with typical savings of £790. Compare nearby locations to see how performance and system sizes vary across the area.
Nearby Home solar panel installation Locations
FAQ
Live Chat: