

Need help right now?
Talk to RoboMo™ and get instant answers.


1 local comparisons · Newcastle Upon Tyne
Explore how homes in Newcastle Upon Tyne are performing with Home solar panel installation. Real comparison data reveals typical system sizes, generation levels, and the level of savings being achieved locally.
Most homes in Newcastle Upon Tyne are currently saving between £783 and £783 per year based on real comparison data. Typical systems are achieving around £783 annually, while high-performing installations are reaching up to £783 when optimised for roof size, orientation, and usage.
Solar performance in Newcastle Upon Tyne depends heavily on roof orientation, pitch and shading. Properties with south-facing or east-west roofs typically achieve the strongest generation results, while shading from nearby buildings or trees can reduce performance.
Based on local comparison data, the average system in Newcastle Upon Tyne generates around 3559 kWh per year. Strong-performing systems are reaching up to 3558 kWh, with most homes installing around 9 panels depending on available roof space.
Typical yearly generation
3559 kWh
What a usual system here is modelled to produce
Typical yearly saving
£783
From £783 to £783
Usual system
9 panels
Mostly 400W
Best result in the data
3558 kWh
Highest modelled yearly output
Enter a postcode. RoboMo™ uses it to see how many panels of each type fit that roof.
Enter your postcode to start your assessment.
RoboMo™ analyses your roof and builds your personalised solar comparison.
Properties here are typically modelled at 3559 kWh a year, from systems of about 9 panels. The score mixes that output with how many people are comparing solar in the area.
Planning considerations in Newcastle Upon Tyne
Most residential solar installations in Newcastle Upon Tyne fall under permitted development and do not require planning permission. However, properties within conservation areas or listed buildings may require approval, particularly where panels are visible from public viewpoints.
Local trends indicate that many homes in Newcastle Upon Tyne are opting for larger systems to maximise long-term savings, with east-west split systems becoming increasingly popular to extend generation across more hours of the day.
Local score
out of 100
Yearly output
kWh, best 3558
Yearly saving
up to £783
South-facing roofs
of modelled systems
Average system
panels, scale to 40
Common panel class
scale to 600W
Best modelled year
kWh peak in the data
Roof direction
South 0%
East/west 50%
Mixed 50%
Flat 0%
Figures come from real residential comparisons for local homes. They show the system sizes people compare and the generation those sizes reach.
| Panel type | Typical setup | Average yearly generation |
|---|---|---|
| 9 panel system High-efficiency panel | 9 panels | 3559 kWh |
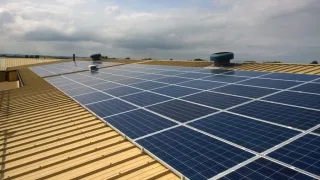
Armstrong Industrial Estate, Unit 11 Whitworth Rd, Armstrong, Washington NE37 1PP, United Kingdom NE37 1PP


Maryholme, Hallbankgate, Brampton CA8 2NE, United Kingdom CA8 2NE

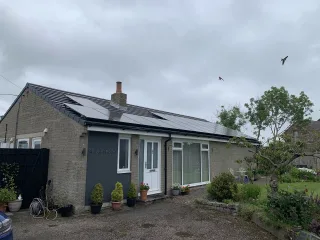
14 Holstead Cl, Carlisle CA2 5FY, UK CA2 5FY
Most homes here are modelled around 3559 kWh a year, with typical savings of £783.
Compare installers and prices for solar in Newcastle Upon Tyne.
Get solar quotes in Newcastle Upon TyneFAQ
Live Chat: