Explore how homes in Brighton And Hove are performing with Home solar panel installation. Real comparison data reveals typical system sizes, generation levels, and the level of savings being achieved locally.
Explore residential solar panel installation in Brighton And Hove. Compare your roof, electricity use and local installation options.
Explore solar panel installation in Brighton And Hove.
Last checked: 4 November 2026. All numbers carry a source and a check date, and estimates say so.
Brighton and Hove is one unitary council covering Brighton, Hove, Portslade and the downland villages such as Rottingdean, Ovingdean and Patcham. Census 2021 counts 121,402 households across the city (ONS TS044). Exactly half (50.0%) are in flats or converted buildings, 10.3% are detached, 25.1% are owned outright and 32.7% are rented privately (ONS TS054).
For the full city guide, with roof-direction tables and the council’s four planning cases, read solar panels in Brighton. Nearby towns with their own guides: solar panels in Worthing and solar panels in Burgess Hill in West Sussex, and solar panels in Eastbourne along the coast to the east.
Using Kilowatts in Brighton and Hove
Kilowatts UK is a quote comparison platform. Drop a pin on your house, RoboMo™ sketches where panels could sit, and the saved design goes to independent partner installers to price. The firm you choose then does the site survey, the install and the grid notification, and you contract with it, not with us.
Brighton or Hove: does the side of the city matter?
PVGIS estimates for a 3.5 kWp roof in central Brighton (50.823, -0.138), 35° pitch
| Roof faces | kWh per kWp a year (PVGIS estimate) | 3.5 kWp array, yearly kWh (estimate) |
|---|
| South | 1,121 | 3,924 |
| South-east | 1,045 | 3,658 |
| East | 867 | 3,034 |
| North | 572 | 2,002 |
Model notes: figures come from PVGIS 5.3 PVcalc (SARAH3 radiation data), for 1 kWp mounted on a building at 35° with 14% losses and the horizon profile switched on; 0° means south, -90° east, 90° west. Locations: Brighton (50.823, -0.138) and Hove (50.829, -0.170). Retrieved 4 November 2026. Modelled, not measured.
Typical costs in the city
| City-wide example | Indicative installed cost (estimate) | How we got it |
|---|
| 3.5 kWp, solar only | ≈ £6,500 | DESNZ South East mean £1,858.90 per kW (up to 4 kW) |
| 5 kWp, solar only | ≈ £8,600 | DESNZ South East mean £1,721.49 per kW (4–10 kW) |
| 5 kWp + 5 kWh battery | ≈ £13,200 | solar estimate + about £4,600 for a 5 kWh battery (Energy Saving Trust) |
These are an example (estimate) for each size, built from the DESNZ Solar PV cost data 2025/26 (published 28 May 2026) and the Energy Saving Trust battery guide. A real quote also prices scaffolding, access and any consumer unit work.
Installation of solar panels and batteries in homes carries 0% VAT until 31 March 2027 under the energy-saving materials relief (HMRC Notice 708/6).
One council for planning
Every address in the city is handled by Brighton & Hove City Council. Outside protected areas, house roofs are usually permitted development under GPDO Part 14, Class A as amended by SI 2026/896. The council lists 34 conservation areas (Planning Data register), and says solar on houses in five Article 4 areas always needs permission: Ovingdean, Patcham, Portslade Old Village, Rottingdean and Stanmer (heritage guidance). The Brighton guide sets out each case.
Batteries
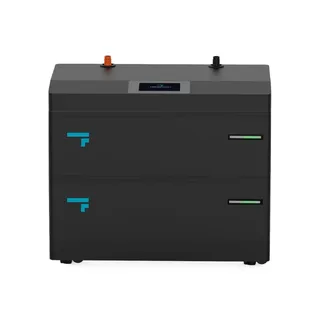
With so many flats, a battery is often the simpler project where the roof is shared. Use the battery quote form for battery-only quotes, or read home battery prices explained.
home battery storage in East Sussex
Partner installers for Brighton and Hove
Partner installers cover Brighton and Hove. Or look through the installer directory.
Neighbouring areas
Found your roof on the map? Get installer quotes.
Sources
- ONS Census 2021, TS044 Accommodation type (Nomis): Census day 21 March 2021; percentages are ours; checked 4 November 2026.
- ONS Census 2021, TS054 Tenure (Nomis): Census day 21 March 2021; percentages are ours; checked 4 November 2026.
- PVGIS 5.3 PVcalc (European Commission JRC), SARAH3 data: model run 4 November 2026.
- DESNZ, Solar PV cost data 2025/26 (Total Installed Capacity): published 28 May 2026; covers April 2025 to March 2026.
- Energy Saving Trust, Battery storage: checked 4 November 2026.
- Energy Saving Trust, Solar panels: checked 4 November 2026 (EST figures use fuel prices as of July 2026).
- Ofgem, Changes to energy price cap between 1 October and 31 December 2026: applies 1 October to 31 December 2026.
- HMRC, VAT on energy-saving materials and heating equipment (Notice 708/6): zero rate 1 May 2023 to 31 March 2027; checked 4 November 2026.
- Brighton & Hove City Council, Installing solar panels on your home: checked 4 November 2026.
- Brighton & Hove City Council, Improving energy saving and sustainability in conservation areas and listed buildings: checked 4 November 2026.
- Planning Data (MHCLG), Conservation area dataset: records counted by council on 4 November 2026: Eastbourne 12, Brighton and Hove 34, Wealden 33, Lewes 28, Hastings 18, Rother 10.
- GPDO 2015, Schedule 2, Part 14, Class A: checked 3 November 2026.
- The Town and Country Planning (General Permitted Development) (England) (Amendment) Order 2026 (SI 2026/896): amends Part 14 Class A; checked 3 November 2026.
Solar performance in Brighton And Hove depends heavily on roof orientation, pitch and shading. Properties with south-facing or east-west roofs typically achieve the strongest generation results, while shading from nearby buildings or trees can reduce performance.
Choose a town below or start a property assessment to explore suitable solar options.