


Why are UK electricity prices so high?
Published: 2026-07-25 16:54:37
Updated: 2026-10-17 15:59:25
Why are UK electricity prices so high? Debunking solar panel myths with cold-hard ROI math breakdown.
Update - 17 October 2026
Since the July version of this guide, Great Britain has moved into the October to December 2026 price-cap period. Ofgem still sets unit rates and standing charges by region and payment method, and those figures can differ from the rates used in the worked examples below. Treat 24p/kWh, 8p/kWh and the solar and battery cost figures as a calculation method, not a current quote or a forecast. Check the live cap, your own bill and your export tariff before you rely on any payback.
A higher import rate still makes on-site solar more valuable than exporting it, which is why a home battery is often added to the conversation. It can store surplus daytime generation for the evening, and on some tariffs it can charge at off-peak times. It does not automatically shorten payback. The extra self-consumption has to cover the extra installed cost, after losses, over the life you expect from the system.
If you are comparing options, start with your annual kWh, daytime loads and evening demand, then sense-check battery cost and the right battery size against a written quote. To have those numbers checked on your property, book a free survey.
Original article
The guide below is the original article, left as it was published. The update above is what has changed since then.
Why are UK electricity prices so high?
Why are UK electricity prices so high? Debunking solar panel myths with cold-hard ROI math breakdown.
Why are UK electricity prices so high? Debunking solar panel myths with cold-hard ROI math breakdown
UK electricity prices explained: why bills are still so high
Last updated: 26 July 2026. UK energy figures change frequently, especially Ofgem price-cap rates, export tariffs and solar installation costs. Treat any worked example in this guide as a transparent calculation method, not a quote or a forecast. Before buying solar panels, a battery or a tariff, check your own unit rate, standing charge, export rate, roof survey and written installation quote.
UK electricity prices are high because household bills are still exposed to gas-linked wholesale electricity prices, network costs, supplier operating costs, policy costs, VAT and standing charges. Even when renewables generate a large share of Britain's electricity, gas-fired power stations can still influence the wholesale price at key times. That is one reason many households still ask why electricity is so high even as wind and solar capacity grows. For homeowners considering solar panels or home batteries, high grid prices can improve the economics. They do not make every system a good investment by default. The return depends on roof suitability, shading, self-consumption, export tariff, battery size, installation cost, grid-export arrangements and how long you expect to stay in the property. The sources behind the numbers The most trustworthy way to understand current electricity prices is to separate live regulatory data from illustrative maths. Ofgem's price-cap pages provide the official cap levels, regional unit rates and standing charges for default domestic tariffs. Ofgem also publishes methodology and cost-stack information explaining how the cap is built up. Those pages should be checked directly because the cap changes by quarter and varies by payment method and region. For solar costs and performance, consumer guidance from the Energy Saving Trust and market data from MCS are useful starting points, but they are not a substitute for a property-specific quote. Export payments should be checked with suppliers and Ofgem's Smart Export Guarantee guidance, because SEG rates are not a single national price and can change by supplier, tariff and eligibility. Why gas still affects electricity prices The confusing part is that the UK can have plenty of wind, solar and nuclear generation on the system, yet electricity prices can still move with gas. This is because wholesale power prices are often influenced by the marginal generator: the plant needed to meet demand at a given time. When that plant is gas-fired, gas prices can influence the electricity price even if cheaper renewables are also generating. That does not mean renewables are responsible for high bills. It means market design, flexible generation, demand peaks, low-wind periods, imports, storage limits and network constraints all affect the price households eventually pay. This is why debates about energy policy and prices can be misleading if they reduce the problem to one technology. UK gas exposure also matters because Britain is connected to international gas markets. Domestic production does not meet all demand, and imported gas and global LNG prices can influence costs. When international gas prices rise, the effect can pass through to wholesale electricity prices, supplier hedging costs and ultimately the price cap. What makes up a domestic electricity bill A household electricity bill is more than the cost of the units you use. It is a mix of variable charges, fixed daily charges and wider system costs. Some elements are national, while others vary by distribution region, payment method and tariff type. A common source of confusion is the headline Ofgem price-cap figure. Ofgem often communicates the cap using a typical dual-fuel household paying by direct debit. That headline is useful for comparing quarters, but it is not the same as an electricity-only bill, and it is not a cap on your total annual spend. Electricity-only households, electrically heated homes, EV owners and high-usage homes need to look at the actual unit rate and standing charge that apply to them.
| Bill component | What it means | Why it matters for electricity customers |
|---|---|---|
| Wholesale energy | The cost suppliers face when buying energy for customers, including hedging effects | This has been a major driver of high bills since the gas-price shock, and electricity can still be linked to gas-fired generation. |
| Network costs | The cost of transmission and local distribution networks | These vary by region and help explain why two similar homes can pay different rates. |
| Operating and industry costs | Supplier running costs, metering, customer service, bad debt and industry obligations | These are real costs in the cap, but they should not be confused with pure supplier profit. |
| Policy costs | Government and social/environmental scheme costs recovered through bills | These are politically debated, but they are not usually the largest part of the cap. |
| VAT | Domestic energy VAT charged at the reduced rate | VAT is applied to domestic energy bills and is separate from supplier margin. |
| Supplier margin allowance | The earnings allowance built into the cap methodology | This is smaller than many people assume when compared with wholesale and network costs. |
| Assumption | Example value | Why it matters |
|---|---|---|
| Solar array size | 3.5 kWp | A common domestic scale for comparison, not a recommendation for every roof. |
| Annual generation | 3,000 kWh | Actual output depends on orientation, pitch, shading, location and system design. |
| Installed solar cost | £6,100 | Used here as an example quote figure, not a current national price claim. |
| Import unit rate avoided | 24p/kWh | Use the electricity unit rate from your own tariff. |
| Export rate | 8p/kWh | SEG and export tariffs vary by supplier and may change. |
| Self-consumption without battery | 40% | Higher daytime use improves the return. |
| Export without battery | 60% | Exported electricity is usually worth less than self-used electricity. |
| Scenario | Self-used solar | Exported solar | Annual avoided import value | Annual export value | Total annual benefit | Simple payback |
|---|---|---|---|---|---|---|
| Solar only, illustrative case | 1,200 kWh | 1,800 kWh | £288 | £144 | £432 | 14.1 years |
| Scenario | Installed cost | Self-used solar | Exported solar | Total annual benefit | Simple payback |
|---|---|---|---|---|---|
| Solar only, illustrative case | £6,100 | 1,200 kWh | 1,800 kWh | £432 | 14.1 years |
| Solar plus battery, illustrative case | £10,100 | 2,100 kWh | 900 kWh | £576 | 17.5 years |
| Self-consumption | Export rate | Annual benefit | Simple payback |
|---|---|---|---|
| 30% | 5p/kWh | £321 | 19.0 years |
| 40% | 8p/kWh | £432 | 14.1 years |
| 50% | 8p/kWh | £480 | 12.7 years |
| 60% | 15p/kWh | £630 | 9.7 years |
Plan, Compare & Buy Renewable Energy Solutions
AI does the thinking.
You get the perfect solar match.
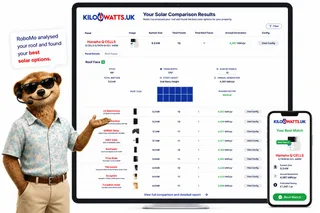
Use RoboMo™ to assess your property, compare available technologies and connect with trusted UK installers, suppliers and manufacturers.
Simply enter your postcode, drop a pin on your roof, create your free account and let RoboMo™ analyse your property to find the best solar panels for your home.

You don't have to think
RoboMo™'s AI analyses your roof and does all the hard work.

Accurate & tailored
AI-powered assessment based on your roof, location, and conditions.

Best options, maximum savings
Compare top solar panels for the best performance and value.

Simple, fast & effortless
Provide a few details, sit back and watch your results unfold.

STEP 1
Choose Home, Business or Industrial
Enter your postcode to start your assessment.
STEP 2

Drop a pin on your roof
STEP 3

Create your free account
STEP 4

Sit back and watch RoboMo™ work
RoboMo™ analyses your roof and builds your personalised solar comparison.

Kilowatts UK is an authorised representative
Flower Turbines
Compact vertical-axis turbines built for real UK sites, not just open farmland.
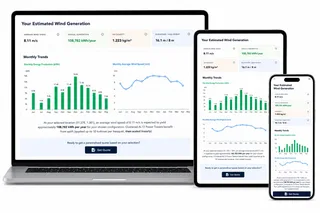
They start in light wind, sit in a small footprint, and are bird-safe by design. Cluster them as a bouquet and the group performs better together than the same turbines standing alone. Enter your postcode for a location-based generation estimate. Figures use area weather data and will differ if buildings, trees or hills sit in the way.
Starts in light UK wind
Built to generate in typical UK wind, not only open farmland.
Small rooftop or ground footprint
Compact towers for roofs, yards and tight sites.
Bird-safe slow rotation
Slow vertical-axis spin, bird-safe by design.
Bouquet clusters raise output
Grouped turbines outperform the same units standing alone.

Step 1
Enter your postcode
Start designing your wind energy system in seconds.
STEP 2

Choose a location
STEP 3

Place your cluster
Tap the map where you want the turbine cluster to go.
STEP 4

Instant generation forecasts
Compare different turbine layouts and see annual generation forecasts instantly.
STEP 5

No commitment required
Explore different configurations before deciding whether to request a quotation.
Related articles
Mo's Mission Nominations
FAQ
Need Help? RoboMo's Got Answers
What drives up UK electricity prices?
The UK's electricity sector has undergone significant reforms in recent years, driven by changes in global gas prices, energy policy debates, and the need for more efficient cost recovery mechanisms. This is a complex issue with multiple factors at play.
How do rebalancing policy costs away from electricity bills affect consumers?
The debate around rebalancing policy costs away from electricity bills has been ongoing. In our guide to [Compare Home Solar Panel Options](/services/residential/renewable-energy/residential-solar-panel-installation/compare/), we discuss how DESNZ removed average costs of £150 from bills, a move that Energy UK believes could narrow the "spark gap" between electricity and gas prices, supporting electrification. However, concerns remain about the burden falling on taxpayers or other consumers.
What changes did Ofgem make to standing charges?
Ofgem now requires suppliers to offer at least one lower-standing-charge tariff, which could lead to more consumer choice and potentially fairer outcomes for low-usage households. However, there are concerns that bills may not automatically fall, as lower fixed charges could result in higher unit rates, which can hurt high-need households.
How does moving WHD cost recovery from standing charges to unit rates affect consumers?
DESNZ's consultation suggests moving cost recovery from standing charges to unit rates could cut standing charges by about £39 on a typical dual-fuel bill. This approach could be fairer for many low-usage households, but some high-usage households with unavoidable needs may lose out.
What is the significance of social tariff design?
UKERC argues that direct bill support and unit-price discounts can be targeted and effective, but require ongoing funding. The design of social tariffs is crucial to ensure they are targeted effectively and do not exacerbate existing inequalities.
Can policy debates affect UK electricity prices?
Policy debates around options like Pot Zero or RO-to-CfD conversion could save consumers £2 billion to £8 billion a year in the late 2020s, or roughly £20 to £80 per customer per year. This approach could reduce legacy support costs and limit exposure to over-remuneration when market prices are high.
How does faster network build and local compensation affect UK electricity prices?
Our [Warm Homes Plan 2026 Grants & Loans - Energy Upgrades Explained](https://kilowatts.uk/resources/warm-homes-plan-2026-grants-loans-energy-upgrades-explained/) guide highlights the delivery plan and Ofgem's price-cap update reference work to cut constraint costs and a Bill Discount Scheme for households near new or upgraded transmission. This approach could lead to lower wasted power and better local acceptance of grid build-out, but savings depend on delivery speed, network planning, and future constraint-cost trends.
What is the timeline of key UK electricity price events since 2020?
```mermaid timeline title Key UK electricity price events since 2020 2020 : SEG starts for small-scale exports 2021 : Global gas prices rise sharply 2022 : Russia-Ukraine shock deepens gas crisis : Ofgem changes wholesale price cap methodology 2023 : Quarterly price-cap updates become normal 2024 : AR6 CfD results secure offshore, onshore and solar at published strike prices 2025 : Government chooses Reformed National Pricing over zonal pricing : Ofgem confirms lower standing charge tariffs 2026 : Budget-linked bill reforms remove average costs from bills from April : Ofgem lifts Jul-Sep cap as wholesale costs rise again ``` Note: The above timeline chart is not exhaustive, but it highlights key events and reforms that have shaped the UK's electricity price landscape since 2020.